Here is a table listing current Fairfield 15-year fixed rates.
Across the United States 88% of home buyers finance their purchases with a mortgage. Of those people who finance a purchase, nearly 90% of them opt for a 30-year fixed rate loan. The 15-year fixed-rate mortgage is the second most popular home loan choice among Americans, with 6% of borrowers choosing a 15-year loan term.
| Loan Type | Percent of Borrowers Buying a Home | Percent of All Home Buyers |
|---|---|---|
| 30-year Fixed | 90% | 79.2% |
| 15-year Fixed | 6% | 5.28% |
| Adjustable-rate | 2% | 1.76% |
| Other Fixed-Rate Loan Terms | 2% | 1.76% |
| Use Any Type of Financing | 100% | 88% |
| Paid Cash in Full | N/A | 12% |
Source: Freddie Mac's 2016 home buyer statistics, published on April 17, 2017.
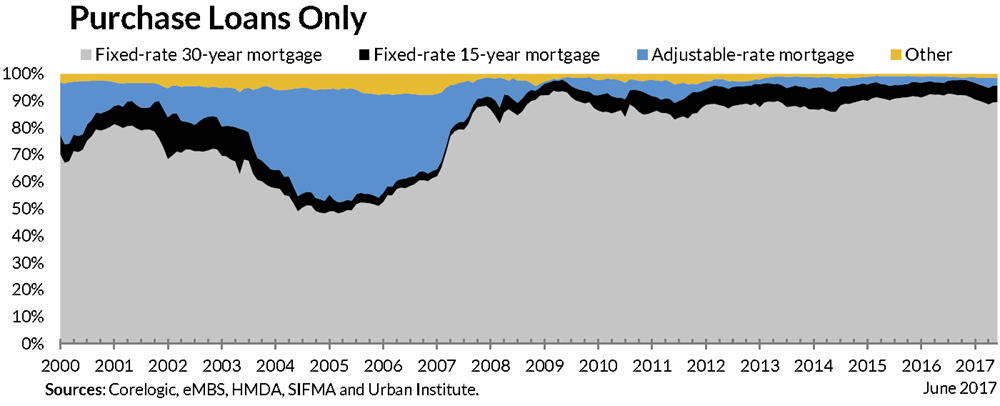
When interest rates are low (as they were after the global recession was followed by many rounds of quantitative easing) home buyers have a strong preference for fixed-rate mortgages. When interest rates rise consumers tend to shift more toward using adjustable-rate mortgages to purchase homes.
Most consumers obtaining mortgages to purchase a home opt for the 30-year fixed-rate mortgage. It completely dominates the purchase market.

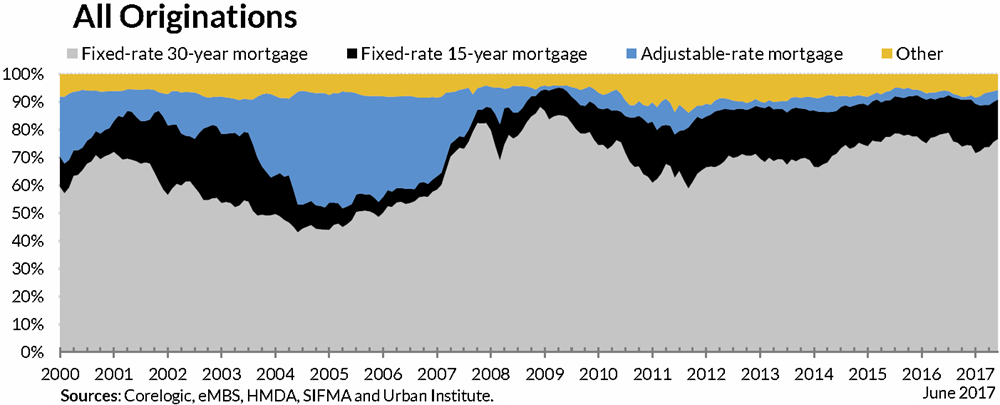
If one looks exclusively at purchases FRMs are about 90% of the market. 30-year loans are also a popular choice for refinancing homeowners, though the 15-year option is also popular with people refinancing their loans. The following chart shows the blended overall market condition, but if you can compare it against the above chart you can visualize how 15-year loans are much more popular for refinancing than for initial home purchases.

Source: Urban Institute
The big advantage of a 30-year home loan over a 15-year loan is a lower monthly payment. This lower payment in turn makes it easier for home buyers to qualify for a larger loan amount.
If the homeowner has other investments which offer superior returns to real estate then they can invest the monthly difference into those higher yielding investments.
Homeowners can also deduct mortgage interest expense from their income taxes on the first $750,000 of mortgage debt. Slowly paying down mortgage debt while accumulating assets in a tax-advantaged retirement account can help people compound wealth quicker.
Provided one has a stable job & a stable source of income, financing their home using a 30-year loan offers great flexibility. If interest rates rise, the monthly loan payments do not change. If interest rates fall, the home buyer can refinance into a lower rate and/or a shorter duration loan. And if an owner comes into some money through a work bonus, an inheritance or another winfall they can apply any extra cash to pay down their loan quicker.
Of course the pro for one type of loan is the con for another. The above advantages can also be viewed as disadvantages in certain circumstances. For example, if the cap on mortgage interest deductability is lowered then that benefit is reduced. And if the stock market declines sharply after one invests aggressively near peak valuations then they probably would have been better off using that money to pay down their mortgage quicker.
The flexibility of a 30-year payment plan can be both a blessing and a curse. For those who are disciplined making extra payments while retaining the longer duration loan can be a good move. But many people find ways to spend whatever "extra" cash they have laying around & for these people a shorter duration loan that builds equity faster can be a great decision.
Buyers who can afford the slightly higher monthly payment associated with a shorter duration mortgage have a number of advantages.

The following table shows loan balances on a $200,000 home loan after 5, 10 , 15 & 20 years for loans on the same home.
| Mortgage Type | 15-YR FRM | 20-YR FRM | 30-YR FRM |
|---|---|---|---|
| Interest Rate (APR) | 3.055% | 3.500% | 3.575% |
| Monthly Principal & Interest | $1,386.46 | $1,159.92 | $906.48 |
| Total Monthly Payment | $1,890.62 | $1,664.08 | $1,410.64 |
| Loan Balance 5 Years | $143,207.32 | $162,253.12 | $179,624.58 |
| Equity Built, 5 Years | $106,792.68 + Appreciation | $87,746.88 + Appreciation | $70,375.42 + Appreciation |
| Remaining P & I payments | 120 | 180 | 300 |
| Loan Balance 10 Years | $77,054.84 | $117,298.78 | $155,267.83 |
| Equity Built, 10 Years | $172,945.16 + Appreciation | $132,701.22 + Appreciation | $94,732.17 + Appreciation |
| Remaining P & I payments | 60 | 120 | 240 |
| Loan Balance 15 Years | $0 | $63,760.68 | $126,151.61 |
| Equity Built, 15 Years | $250,000 + Appreciation | $186,239.32 + Appreciation | $123,848.39 + Appreciation |
| Remaining P & I payments | 0 | 60 | 180 |
| Loan Balance 20 Years | $0 | $0 | $91,345.98 |
| Equity Built, 20 Years | $250,000 + Appreciation | $250,000 + Appreciation | $158,654.02 + Appreciation |
| Remaining P & I payments | 0 | 0 | 120 |
| Total Interest Expense | $49,562.77 | $78,380.66 | $126,334.03 |
Please note the above used interest rates were relevant on the day of publication, but interest rates change daily & depend both on the individual borrower as well as broader market conditions.
The above calculations presume a 20% down payment on a $250,000 home, any closing costs paid upfront, 1% homeowner's insurance & an annual property tax of 1.42%.
The following table lists historical average annual mortgage rates for 15-year & 30-year mortgages. 2023 data is through the end of November.
| Year | 30-YR FRM Rate | 30-YR Points | 15-YR FRM Rate | 15-YR Points | 15 vs 30 Rate Diff |
|---|---|---|---|---|---|
| 2023 | 6.81 | 6.11 | -0.70 | ||
| 2022 | 5.34 | 0.81 | 4.58 | 0.85 | -0.76 |
| 2021 | 2.96 | 0.68 | 2.27 | 0.64 | -0.69 |
| 2020 | 3.11 | 0.73 | 2.60 | 0.69 | -0.51 |
| 2019 | 3.94 | 0.5 | 3.39 | 0.5 | -0.56 |
| 2018 | 4.54 | 0.5 | 4.00 | 0.5 | -0.54 |
| 2017 | 3.99 | 0.5 | 3.27 | 0.5 | -0.72 |
| 2016 | 3.65 | 0.5 | 2.93 | 0.5 | -0.72 |
| 2015 | 3.85 | 0.6 | 3.09 | 0.6 | -0.76 |
| 2014 | 4.17 | 0.6 | 3.29 | 0.6 | -0.88 |
| 2013 | 3.98 | 0.7 | 3.11 | 0.7 | -0.87 |
| 2012 | 3.66 | 0.7 | 2.93 | 0.7 | -0.73 |
| 2011 | 4.45 | 0.7 | 3.68 | 0.7 | -0.77 |
| 2010 | 4.69 | 0.7 | 4.1 | 0.7 | -0.59 |
| 2009 | 5.04 | 0.7 | 4.57 | 0.7 | -0.47 |
| 2008 | 6.03 | 0.6 | 5.62 | 0.6 | -0.41 |
| 2007 | 6.34 | 0.4 | 6.03 | 0.4 | -0.31 |
| 2006 | 6.41 | 0.5 | 6.07 | 0.5 | -0.34 |
| 2005 | 5.87 | 0.6 | 5.42 | 0.6 | -0.45 |
| 2004 | 5.84 | 0.7 | 5.21 | 0.6 | -0.63 |
| 2003 | 5.83 | 0.6 | 5.17 | 0.6 | -0.66 |
| 2002 | 6.54 | 0.6 | 5.98 | 0.6 | -0.56 |
| 2001 | 6.97 | 0.9 | 6.5 | 0.9 | -0.47 |
| 2000 | 8.05 | 1 | 7.72 | 1 | -0.33 |
| 1999 | 7.44 | 1 | 7.06 | 1 | -0.38 |
| 1998 | 6.94 | 1.1 | 6.59 | 1.1 | -0.35 |
| 1997 | 7.6 | 1.7 | 7.13 | 1.7 | -0.47 |
| 1996 | 7.81 | 1.7 | 7.32 | 1.7 | -0.49 |
| 1995 | 7.93 | 1.8 | 7.48 | 1.8 | -0.45 |
| 1994 | 8.38 | 1.8 | 7.86 | 1.8 | -0.52 |
| 1993 | 7.31 | 1.6 | 6.83 | 1.6 | -0.48 |
| 1992 | 8.39 | 1.7 | 7.96 | 1.7 | -0.43 |
| 1991 | 9.25 | 2 | |||
| 1990 | 10.13 | 2.1 | |||
| 1989 | 10.32 | 2.1 | |||
| 1988 | 10.34 | 2.1 | |||
| 1987 | 10.21 | 2.2 | |||
| 1986 | 10.19 | 2.2 | |||
| 1985 | 12.43 | 2.5 | |||
| 1984 | 13.88 | 2.5 | |||
| 1983 | 13.24 | 2.1 | |||
| 1982 | 16.04 | 2.2 | |||
| 1981 | 16.63 | 2.1 | |||
| 1980 | 13.74 | 1.8 | |||
| 1979 | 11.2 | 1.6 | |||
| 1978 | 9.64 | 1.3 | |||
| 1977 | 8.85 | 1.1 | |||
| 1976 | 8.87 | 1.1 | |||
| 1975 | 9.05 | 1.1 | |||
| 1974 | 9.19 | 1.2 | |||
| 1973 | 8.04 | 1 | |||
| 1972 | 7.38 | 0.9 |
Source: Freddie Mac PMMS.
Home buyers who have a strong down payment are typically offered lower interest rates. Homeowners who put less than 20% down on a conventional loan also have to pay for property mortgage insurance (PMI) until the loan balance falls below 80% of the home's value. This insurance is rolled into the cost of the monthly home loan payments & helps insure the lender will be paid in the event of a borrower default. Typically about 35% of home buyers who use financing put at least 20% down.

As of 2025 the FHFA set the conforming loan limit for single unit homes across the continental United States to $806,500, with a ceiling of 150% that amount in areas where median home values are higher. The limit is as follows for 2, 3, and 4-unit homes $1,032,650, $1,248,150, and $1,551,250. The limits are higher in Alaska, Hawaii, Guam, the U.S. Virgin Islands & other high-cost areas. Loans which exceed these limits are classified as jumbo loans.
The limits in the first row apply to all areas of Alabama, Arizona, Arkansas, Delaware, Georgia, Illinois, Indiana, Iowa, Kansas, Kentucky, Louisiana, Maine, Michigan, Minnesota, Mississippi, Missouri, Montana, Nevada, New Mexico, North Dakota, Ohio, Oklahoma, Rhode Island, South Carolina, South Dakota, Texas, Vermont, Wisconsin & most other parts of the continental United States. Some coastal states are homes to metro areas with higher property prices which qualify the county they are in as a HERA designated high-cost areas.
The limits in the third row apply to Alaska, Guam, Virgin Islands, Washington D.C & Hawaii.
| Units | 1 | 2 | 3 | 4 |
|---|---|---|---|---|
| Continental U.S. Baseline | $806,500 | $1,032,650 | $1,248,150 | $1,551,250 |
| Designated High-cost Areas | $1,209,750 | $1,548,975 | $1,872,225 | $2,326,875 |
| Alaska, Hawaii, Guam & U.S. Virgin Islands | $1,209,750 | $1,548,975 | $1,872,225 | $2,326,875 |