America is undergoing a severe cost-of-living crisis that has only been deepening with each passing year. Rent prices continue to exceed overall price inflation, mortgage rates are at a multi-decade high, and there is a housing shortage of over seven million affordable homes. The United States housing crisis has seemingly accelerated since the COVID-19 pandemic—both the cost of rent and the cost of purchasing a home has risen steeply in the past four years, with demand outpacing supply, especially in metropolitan areas.
The number of cost-burdened households (a household that spends over 30% of their income on housing costs) has reached nearly one-third of all households, the highest rate since 2015. According to the United States Census Bureau, renters experience the brunt of this burden; almost half of all renter households are cost-burdened, paying around 31% of their income towards housing. For 70% of extremely low-income families, over half of income goes to housing.
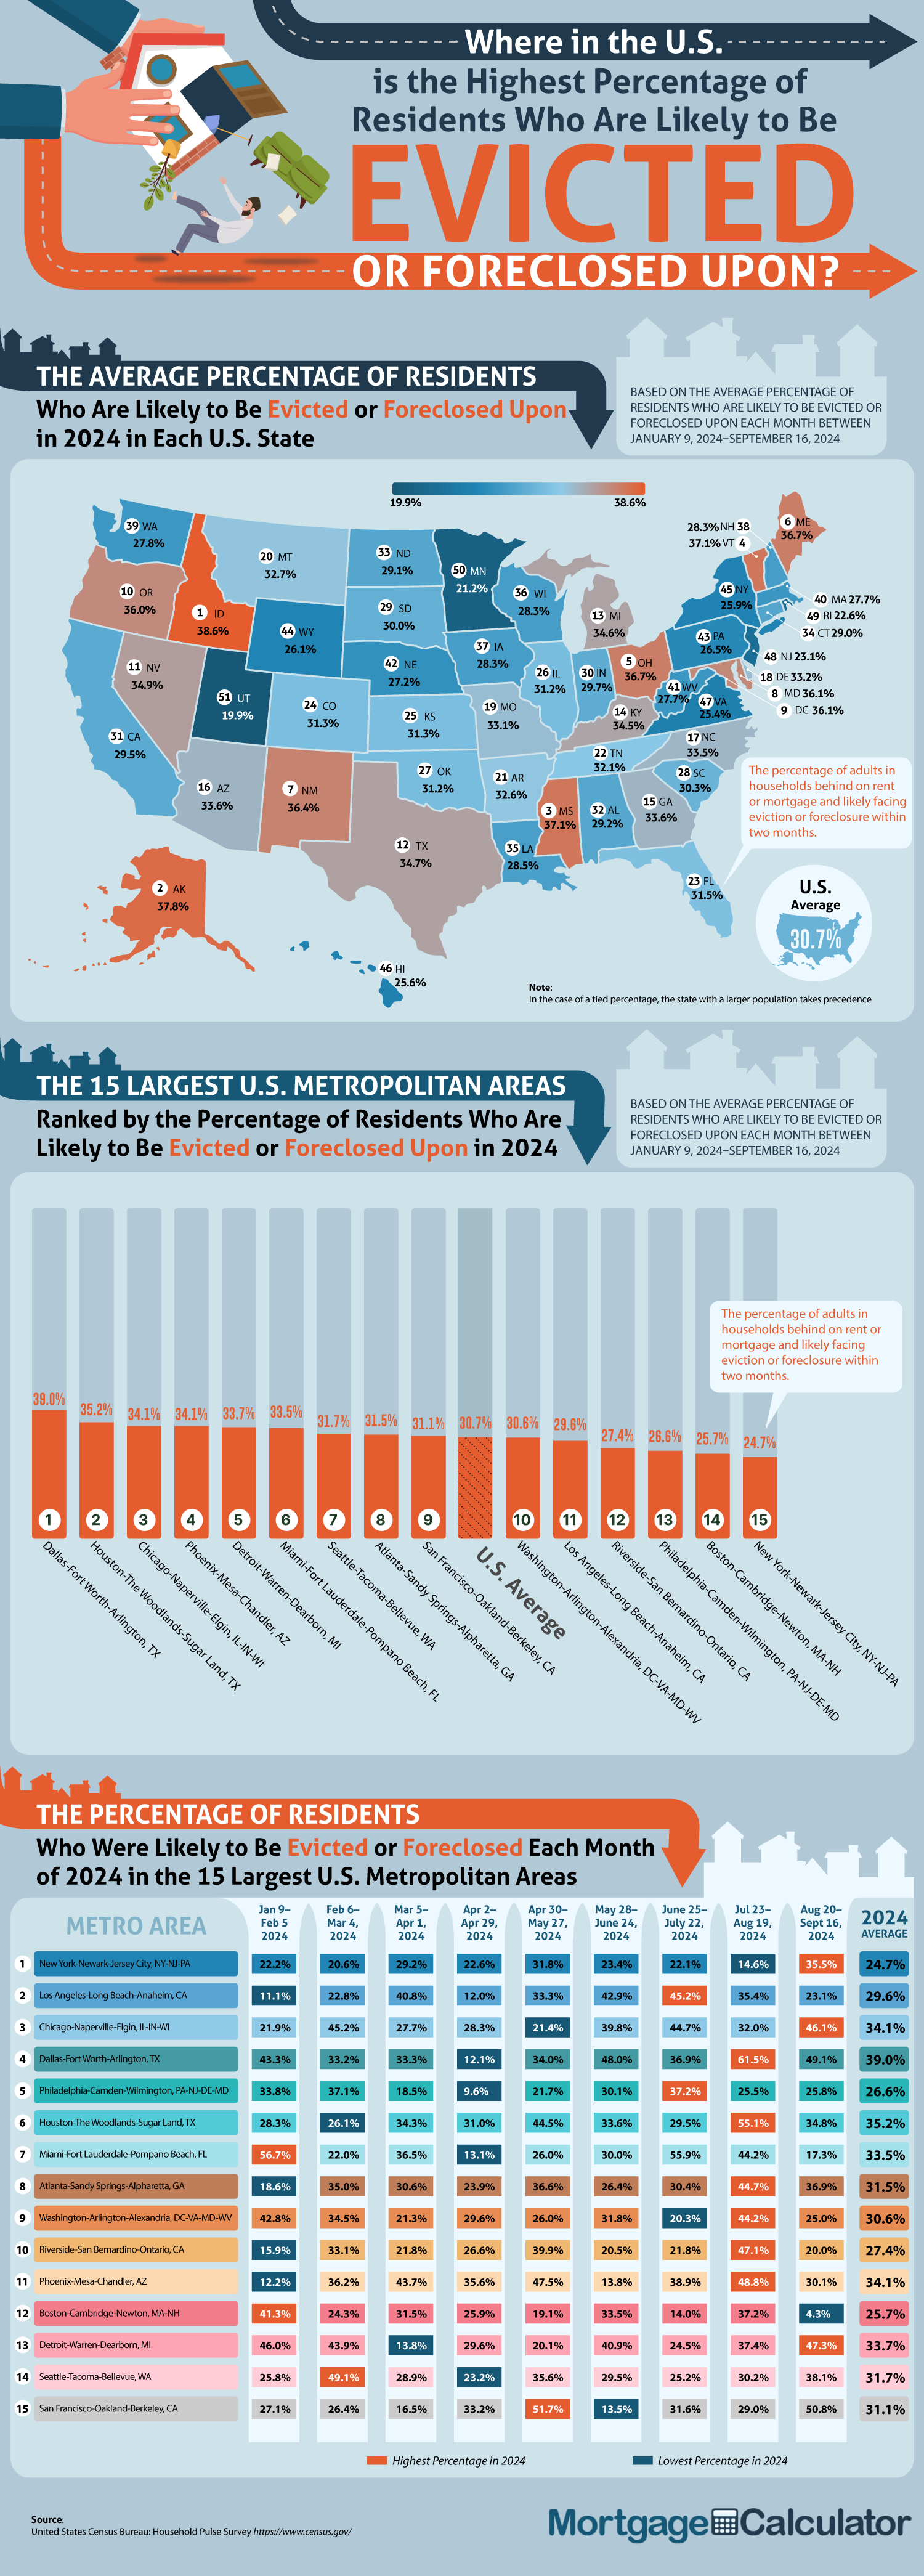
The unfortunate reality is that with U.S. housing costs reaching debilitating levels, foreclosure rates and eviction rates are following suit—around 30% face losing their homes in major U.S. cities! The cost-of-living crisis varies in severity across the country, so the team at MortgageCalculator.org has conducted a nationwide analysis to shed light on where residents are facing the highest likelihood of evictions or foreclosures. The results are alarming:
The volatility of the housing market means that eviction rates also vary dramatically by location throughout the year. First, we will reveal the five U.S. cities with the highest eviction rates and highest foreclosure rates overall (based on percentage of residents who are likely to be evicted or foreclosed upon):
Why is housing insecurity so high in Dallas, Texas? A presentation by the City Council of Dallas found substantial evidence of a “dramatic decrease” in affordable homes for its residents. Fewer than one-fifth of renters in Dallas make the $100,000 salary required to afford a typical Dallas home, and there are 40,000 too few homes that are affordable for households making an annual salary of $55,000 or below. The rental insecurity of Dallas has become increasingly dire; there are 100,000 fewer rental units available for $1,000 or less monthly since 2017; by contrast, the number of rental units costing $1,500 or more has increased by 66,000. Residents in Dallas face the highest eviction and foreclosure rates from May 28–June 24 at 48% and July 23–August 19 at 61.5% (the highest of all).
In these date ranges, Miami-Fort Lauderdale-Pompano Beach, FL, has the highest rate of residents facing eviction or foreclosure at 56.7%. This staggering number is only the second highest we encountered in our housing crisis analysis. What is contributing to Miami’s housing crisis? According to a report by Miami Homes for All, Miami is experiencing a housing shortage of over 90,000 affordable units. A major contributing factor to housing and rental insecurity in Miami is the cost of living, which is 30.3% above the national average. In addition, the median price for a single-family home in Miami has reached nearly $600,000, a shocking $200,000 more than the average house price in America. Considering that theHousehold Survival Budget in Miami is $76,284, and the median household income is $59,044, it is no wonder that it has become increasingly challenging for people to stay housed in the Florida city.
In this date range, the Seattle-Tacoma-Bellevue, WA, metropolitan area has the highest rate of residents facing eviction or foreclosure at 49.1%. Seattle’s housing crisis is also primarily caused by the lack of affordable housing. According to a Zillow analysis, an annual income of at least $214,000 is required to afford a house in the Seattle area, the highest income needed in the country outside of California, and an increase of $47,000 since 2020.
The Phoenix-Mesa-Chandler, AZ, metropolitan area has the highest rate of residents facing eviction or foreclosure in these date ranges at 43.7 and 35.6%. Arizona’s housing crisis has been brewing since before the pandemic, with rent prices skyrocketing 72% between 2010 and 2022 and home prices increasing by 57% between 2019 and 2023. Incomes are lagging behind with swelling housing prices—minimum wage workers would need to work 86 hours weekly to make $62,252, the annual income required to afford a two-bedroom home. There may be hope on the horizon for housing insecurity in Phoenix with the state government’s Housing Phoenix Plan.
The San Francisco-Oakland-Berkeley, CA, metropolitan area has the highest rate of residents facing eviction or foreclosure for these date ranges at 51.7% and 50.8%. San Francisco’s housing affordability crisis began in the 1990s and has only worsened. One significant exacerbating factor is San Francisco’s extreme cost of living. A ConsumerAffairs report found that to live comfortably in San Francisco, you would need a minimum salary of $131,050. The median rent is $3,276.27, and the median home price is nearly $1.5 million, which is practically unimaginable for the average American. In 2024, Mayor London Breed launched the Housing for All plan to steer San Francisco’s housing crisis in the right direction.
Where are mortgage foreclosure rates and eviction rates the highest on a statewide level? Around 38.6% of Idaho residents face eviction or foreclosure in 2024, the most nationwide. A recent report by the National Association of Realtors found that Idaho has the country's second least affordable housing market, just barely missing first place after Montana. Overall, rent has increased by 40% and home prices by 50% across Idaho in just the past few years. The rental crisis has been particularly severe in Treasure Valley, Idaho’s most populous region, where eviction rates have nearly doubled since 2022.

How to avoid foreclosure and eviction
While there is no surefire way to avoid foreclosure (life is unpredictable, and prices are increasing across the board), there are steps you can take to help secure your home. First, it is important to avoid bad credit mortgages, otherwise known as subprime mortgages. These types of mortgages are often given to people struggling with poor credit, so it is advisable to do what you can to improve your credit score before getting locked into a disadvantageous mortgage. Bad credit mortgages are rife with high interest rates, penalties, and balloon payment stipulations (when the borrower must pay the remaining sum all at once after a specified period has passed).
Making an informed choice between renting and buying a home is a vital step in avoiding eviction or foreclosure as well. Our rent or buy mortgage calculator can help you make educated decisions that are customized to your area and situation.
(Based on the average percentage of residents who are likely to be evicted or foreclosed upon each month between January 9, 2024 – September 16, 2024)
The percentage of adults in households behind on rent or mortgage and likely facing eviction or foreclosure within two months.
| Rank | Metro area | % likely to be evicted or foreclosed upon in 2024 |
|---|---|---|
| 1 | Dallas-Fort Worth-Arlington, TX | 39.0% |
| 2 | Houston-The Woodlands-Sugar Land, TX | 35.2% |
| 3 | Chicago-Naperville-Elgin, IL-IN-WI | 34.1% |
| 4 | Phoenix-Mesa-Chandler, AZ | 34.1% |
| 5 | Detroit-Warren-Dearborn, MI | 33.7% |
| 6 | Miami-Fort Lauderdale-Pompano Beach, FL | 33.5% |
| 7 | Seattle-Tacoma-Bellevue, WA | 31.7% |
| 8 | Atlanta-Sandy Springs-Alpharetta, GA | 31.5% |
| 9 | San Francisco-Oakland-Berkeley, CA | 31.1% |
| 10 | Washington-Arlington-Alexandria, DC-VA-MD-WV | 30.6% |
| 11 | Los Angeles-Long Beach-Anaheim, CA | 29.6% |
| 12 | Riverside-San Bernardino-Ontario, CA | 27.4% |
| 13 | Philadelphia-Camden-Wilmington, PA-NJ-DE-MD | 26.6% |
| 14 | Boston-Cambridge-Newton, MA-NH | 25.7% |
| 15 | New York-Newark-Jersey City, NY-NJ-PA | 24.7% |
| U.S. average | 30.7% |
The percentage of residents who were likely to be evicted or foreclosed upon each month of 2024 in the 15 largest U.S. metropolitan areas
| Rank | Metro area | Percentage |
|---|---|---|
| 1 | Miami-Fort Lauderdale-Pompano Beach, FL (MFP) | 56.7% |
| 2 | Detroit-Warren-Dearborn, MI (DWD) | 46.0% |
| 3 | Dallas-Fort Worth-Arlington, TX (DFA) | 43.3% |
| 4 | Washington-Arlington-Alexandria, DC-VA-MD-WV (WAA) | 42.8% |
| 5 | Boston-Cambridge-Newton, MA-NH (BCN) | 41.3% |
| 6 | Philadelphia-Camden-Wilmington, PA-NJ-DE-MD (PCW) | 33.8% |
| 7 | Houston-The Woodlands-Sugar Land, TX (HWS) | 28.3% |
| 8 | San Francisco-Oakland-Berkeley, CA (SOB) | 27.1% |
| 9 | Seattle-Tacoma-Bellevue, WA (STB) | 25.8% |
| 10 | New York-Newark-Jersey City, NY-NJ-PA (NNJ) | 22.2% |
| 11 | Chicago-Naperville-Elgin, IL-IN-WI (CNE) | 21.9% |
| 12 | Atlanta-Sandy Springs-Alpharetta, GA (ASA) | 18.6% |
| 13 | Riverside-San Bernardino-Ontario, CA (RSO) | 15.9% |
| 14 | Phoenix-Mesa-Chandler, AZ (PMC) | 12.2% |
| 15 | Los Angeles-Long Beach-Anaheim, CA (LLA) | 11.1% |
| U.S. average | 31.5% |
| Rank | Metro area | Metro abbreviation | Percentage |
|---|---|---|---|
| 1 | Seattle-Tacoma-Bellevue, WA | STB | 49.1% |
| 2 | Chicago-Naperville-Elgin, IL-IN-WI | CNE | 45.2% |
| 3 | Detroit-Warren-Dearborn, MI | DWD | 43.9% |
| 4 | Philadelphia-Camden-Wilmington, PA-NJ-DE-MD | PCW | 37.1% |
| 5 | Phoenix-Mesa-Chandler, AZ | PMC | 36.2% |
| 6 | Atlanta-Sandy Springs-Alpharetta, GA | ASA | 35.0% |
| 7 | Washington-Arlington-Alexandria, DC-VA-MD-WV | WAA | 34.5% |
| 8 | Dallas-Fort Worth-Arlington, TX | DFA | 33.2% |
| 9 | Riverside-San Bernardino-Ontario, CA | RSO | 33.1% |
| 10 | San Francisco-Oakland-Berkeley, CA | SOB | 26.4% |
| 11 | Houston-The Woodlands-Sugar Land, TX | HWS | 26.1% |
| 12 | Boston-Cambridge-Newton, MA-NH | BCN | 24.3% |
| 13 | Los Angeles-Long Beach-Anaheim, CA | LLA | 22.8% |
| 14 | Miami-Fort Lauderdale-Pompano Beach, FL | MFP | 22.0% |
| 15 | New York-Newark-Jersey City, NY-NJ-PA | NNJ | 20.6% |
| U.S. average | 31.2% | ||
| Rank | Metro area | Metro abbreviation | Percentage |
|---|---|---|---|
| 1 | Phoenix-Mesa-Chandler, AZ | PMC | 43.7% |
| 2 | Los Angeles-Long Beach-Anaheim, CA | LLA | 40.8% |
| 3 | Miami-Fort Lauderdale-Pompano Beach, FL | MFP | 36.5% |
| 4 | Houston-The Woodlands-Sugar Land, TX | HWS | 34.3% |
| 5 | Dallas-Fort Worth-Arlington, TX | DFA | 33.3% |
| 6 | Boston-Cambridge-Newton, MA-NH | BCN | 31.5% |
| 7 | Atlanta-Sandy Springs-Alpharetta, GA | ASA | 30.6% |
| 8 | New York-Newark-Jersey City, NY-NJ-PA | NNJ | 29.2% |
| 9 | Seattle-Tacoma-Bellevue, WA | STB | 28.9% |
| 10 | Chicago-Naperville-Elgin, IL-IN-WI | CNE | 27.7% |
| 11 | Riverside-San Bernardino-Ontario, CA | RSO | 21.8% |
| 12 | Washington-Arlington-Alexandria, DC-VA-MD-WV | WAA | 21.3% |
| 13 | Philadelphia-Camden-Wilmington, PA-NJ-DE-MD | PCW | 18.5% |
| 14 | San Francisco-Oakland-Berkeley, CA | SOB | 16.5% |
| 15 | Detroit-Warren-Dearborn, MI | DWD | 13.8% |
| U.S. average | 31.3% | ||
| Rank | Metro area | Metro abbreviation | Percentage |
|---|---|---|---|
| 1 | Phoenix-Mesa-Chandler, AZ | PMC | 35.6% |
| 2 | San Francisco-Oakland-Berkeley, CA | SOB | 33.2% |
| 3 | Houston-The Woodlands-Sugar Land, TX | HWS | 31.0% |
| 4 | Detroit-Warren-Dearborn, MI | DWD | 29.6% |
| 4 | Washington-Arlington-Alexandria, DC-VA-MD-WV | WAA | 29.6% |
| 6 | Chicago-Naperville-Elgin, IL-IN-WI | CNE | 28.3% |
| 7 | Riverside-San Bernardino-Ontario, CA | RSO | 26.6% |
| 8 | Boston-Cambridge-Newton, MA-NH | BCN | 25.9% |
| 9 | Atlanta-Sandy Springs-Alpharetta, GA | ASA | 23.9% |
| 10 | Seattle-Tacoma-Bellevue, WA | STB | 23.2% |
| 11 | New York-Newark-Jersey City, NY-NJ-PA | NNJ | 22.6% |
| 12 | Miami-Fort Lauderdale-Pompano Beach, FL | MFP | 13.1% |
| 13 | Dallas-Fort Worth-Arlington, TX | DFA | 12.1% |
| 14 | Los Angeles-Long Beach-Anaheim, CA | LLA | 12.0% |
| 15 | Philadelphia-Camden-Wilmington, PA-NJ-DE-MD | PCW | 9.6% |
| U.S. average | 30% | ||
| Rank | Metro area | Metro abbreviation | Percentage |
|---|---|---|---|
| 1 | San Francisco-Oakland-Berkeley, CA | SOB | 51.7% |
| 2 | Phoenix-Mesa-Chandler, AZ | PMC | 47.5% |
| 3 | Houston-The Woodlands-Sugar Land, TX | HWS | 44.5% |
| 4 | Riverside-San Bernardino-Ontario, CA | RSO | 39.9% |
| 5 | Atlanta-Sandy Springs-Alpharetta, GA | ASA | 36.6% |
| 6 | Seattle-Tacoma-Bellevue, WA | STB | 35.6% |
| 7 | Dallas-Fort Worth-Arlington, TX | DFA | 34.0% |
| 8 | Los Angeles-Long Beach-Anaheim, CA | LLA | 33.3% |
| 9 | New York-Newark-Jersey City, NY-NJ-PA | NNJ | 31.8% |
| 10 | Miami-Fort Lauderdale-Pompano Beach, FL | MFP | 26.0% |
| 10 | Washington-Arlington-Alexandria, DC-VA-MD-WV | WAA | 26.0% |
| 12 | Philadelphia-Camden-Wilmington, PA-NJ-DE-MD | PCW | 21.7% |
| 13 | Chicago-Naperville-Elgin, IL-IN-WI | CNE | 21.4% |
| 14 | Detroit-Warren-Dearborn, MI | DWD | 20.1% |
| 15 | Boston-Cambridge-Newton, MA-NH | BCN | 19.1% |
| U.S. average | 32.2% | ||
| Rank | Metro area | Metro abbreviation | Percentage |
|---|---|---|---|
| 1 | Dallas-Fort Worth-Arlington, TX | DFA | 48.0% |
| 2 | Los Angeles-Long Beach-Anaheim, CA | LLA | 42.9% |
| 3 | Detroit-Warren-Dearborn, MI | DWD | 40.9% |
| 4 | Chicago-Naperville-Elgin, IL-IN-WI | CNE | 39.8% |
| 5 | Houston-The Woodlands-Sugar Land, TX | HWS | 33.6% |
| 6 | Boston-Cambridge-Newton, MA-NH | BCN | 33.5% |
| 7 | Washington-Arlington-Alexandria, DC-VA-MD-WV | WAA | 31.8% |
| 8 | Philadelphia-Camden-Wilmington, PA-NJ-DE-MD | PCW | 30.1% |
| 9 | Miami-Fort Lauderdale-Pompano Beach, FL | MFP | 30.0% |
| 10 | Seattle-Tacoma-Bellevue, WA | STB | 29.5% |
| 11 | Atlanta-Sandy Springs-Alpharetta, GA | ASA | 26.4% |
| 12 | New York-Newark-Jersey City, NY-NJ-PA | NNJ | 23.4% |
| 13 | Riverside-San Bernardino-Ontario, CA | RSO | 20.5% |
| 14 | Phoenix-Mesa-Chandler, AZ | PMC | 13.8% |
| 15 | San Francisco-Oakland-Berkeley, CA | SOB | 13.5% |
| U.S. average | 32.1% | ||
| Rank | Metro area | Metro abbreviation | Percentage |
|---|---|---|---|
| 1 | Miami-Fort Lauderdale-Pompano Beach, FL | MFP | 55.9% |
| 2 | Los Angeles-Long Beach-Anaheim, CA | LLA | 45.2% |
| 3 | Chicago-Naperville-Elgin, IL-IN-WI | CNE | 44.7% |
| 4 | Phoenix-Mesa-Chandler, AZ | PMC | 38.9% |
| 5 | Philadelphia-Camden-Wilmington, PA-NJ-DE-MD | PCW | 37.2% |
| 6 | Dallas-Fort Worth-Arlington, TX | DFA | 36.9% |
| 7 | San Francisco-Oakland-Berkeley, CA | SOB | 31.6% |
| 8 | Atlanta-Sandy Springs-Alpharetta, GA | ASA | 30.4% |
| 9 | Houston-The Woodlands-Sugar Land, TX | HWS | 29.5% |
| 10 | Seattle-Tacoma-Bellevue, WA | STB | 25.2% |
| 11 | Detroit-Warren-Dearborn, MI | DWD | 24.5% |
| 12 | New York-Newark-Jersey City, NY-NJ-PA | NNJ | 22.1% |
| 13 | Riverside-San Bernardino-Ontario, CA | RSO | 21.8% |
| 14 | Washington-Arlington-Alexandria, DC-VA-MD-WV | WAA | 20.3% |
| 15 | Boston-Cambridge-Newton, MA-NH | BCN | 14.0% |
| U.S. average | 31% | ||
| Rank | Metro area | Metro abbreviation | Percentage |
|---|---|---|---|
| 1 | Dallas-Fort Worth-Arlington, TX | DFA | 61.5% |
| 2 | Houston-The Woodlands-Sugar Land, TX | HWS | 55.1% |
| 3 | Phoenix-Mesa-Chandler, AZ | PMC | 48.8% |
| 4 | Riverside-San Bernardino-Ontario, CA | RSO | 47.1% |
| 5 | Atlanta-Sandy Springs-Alpharetta, GA | ASA | 44.7% |
| 6 | Miami-Fort Lauderdale-Pompano Beach, FL | MFP | 44.2% |
| 6 | Washington-Arlington-Alexandria, DC-VA-MD-WV | WAA | 44.2% |
| 8 | Detroit-Warren-Dearborn, MI | DWD | 37.4% |
| 9 | Boston-Cambridge-Newton, MA-NH | BCN | 37.2% |
| 10 | Los Angeles-Long Beach-Anaheim, CA | LLA | 35.4% |
| 11 | Chicago-Naperville-Elgin, IL-IN-WI | CNE | 32.0% |
| 12 | Seattle-Tacoma-Bellevue, WA | STB | 30.2% |
| 13 | San Francisco-Oakland-Berkeley, CA | SOB | 29.0% |
| 14 | Philadelphia-Camden-Wilmington, PA-NJ-DE-MD | PCW | 25.5% |
| 15 | New York-Newark-Jersey City, NY-NJ-PA | NNJ | 14.6% |
| U.S. average | 29.8% | ||
| Rank | Metro area | Metro abbreviation | Percentage |
| 1 | San Francisco-Oakland-Berkeley, CA | SOB | 50.8% |
| 2 | Dallas-Fort Worth-Arlington, TX | DFA | 49.1% |
| 3 | Detroit-Warren-Dearborn, MI | DWD | 47.3% |
| 4 | Chicago-Naperville-Elgin, IL-IN-WI | CNE | 46.1% |
| 5 | Seattle-Tacoma-Bellevue, WA | STB | 38.1% |
| 6 | Atlanta-Sandy Springs-Alpharetta, GA | ASA | 36.9% |
| 7 | New York-Newark-Jersey City, NY-NJ-PA | NNJ | 35.5% |
| 8 | Houston-The Woodlands-Sugar Land, TX | HWS | 34.8% |
| 9 | Phoenix-Mesa-Chandler, AZ | PMC | 30.1% |
| 10 | Philadelphia-Camden-Wilmington, PA-NJ-DE-MD | PCW | 25.8% |
| 11 | Washington-Arlington-Alexandria, DC-VA-MD-WV | WAA | 25.0% |
| 12 | Los Angeles-Long Beach-Anaheim, CA | LLA | 23.1% |
| 13 | Riverside-San Bernardino-Ontario, CA | RSO | 20.0% |
| 14 | Miami-Fort Lauderdale-Pompano Beach, FL | MFP | 17.3% |
| 15 | Boston-Cambridge-Newton, MA-NH | BCN | 4.3% |
| U.S. average | 27.4% | ||
The average percentage of residents who are likely to be evicted or foreclosed upon in 2024 in each U.S. state (Based on the average monthly percentage between January 9, 2024–September 16, 2024)
| Rank | State | State abbreviation | Average % of residents likely to be evicted or foreclosed upon in 2024 |
|---|---|---|---|
| 1 | Idaho | ID | 38.6% |
| 2 | Alaska | AK | 37.8% |
| 3 | Mississippi | MS | 37.1% |
| 4 | Vermont | VT | 37.1% |
| 5 | Maine | ME | 36.7% |
| 6 | Ohio | OH | 36.7% |
| 7 | New Mexico | NM | 36.4% |
| 8 | District of Columbia | DC | 36.1% |
| 9 | Maryland | MD | 36.1% |
| 10 | Oregon | OR | 36.0% |
| 11 | Nevada | NV | 34.9% |
| 12 | Texas | TX | 34.7% |
| 13 | Michigan | MI | 34.6% |
| 14 | Kentucky | KY | 34.5% |
| 15 | Arizona | AZ | 33.6% |
| 16 | Georgia | GA | 33.6% |
| 17 | North Carolina | NC | 33.5% |
| 18 | Delaware | DE | 33.2% |
| 19 | Missouri | MO | 33.1% |
| 20 | Montana | MT | 32.7% |
| 21 | Arkansas | AR | 32.6% |
| 22 | Tennessee | TN | 32.1% |
| 23 | Florida | FL | 31.5% |
| 24 | Colorado | CO | 31.3% |
| 25 | Kansas | KS | 31.3% |
| 26 | Illinois | IL | 31.2% |
| 27 | Oklahoma | OK | 31.2% |
| 28 | South Carolina | SC | 30.3% |
| 29 | South Dakota | SD | 30.0% |
| 30 | Indiana | IN | 29.7% |
| 31 | California | CA | 29.5% |
| 32 | Alabama | AL | 29.2% |
| 33 | North Dakota | ND | 29.1% |
| 34 | Connecticut | CT | 29.0% |
| 35 | Louisiana | LA | 28.5% |
| 36 | Iowa | IA | 28.3% |
| 37 | New Hampshire | NH | 28.3% |
| 38 | Wisconsin | WI | 28.3% |
| 39 | Washington | WA | 27.8% |
| 40 | Massachusetts | MA | 27.7% |
| 41 | West Virginia | WV | 27.7% |
| 42 | Nebraska | NE | 27.2% |
| 43 | Pennsylvania | PA | 26.5% |
| 44 | Wyoming | WY | 26.1% |
| 45 | New York | NY | 25.9% |
| 46 | Hawaii | HI | 25.6% |
| 47 | Virginia | VA | 25.4% |
| 48 | New Jersey | NJ | 23.1% |
| 49 | Rhode Island | RI | 22.6% |
| 50 | Minnesota | MN | 21.2% |
| 51 | Utah | UT | 19.9% |
Source:
United States Census Bureau: Household Pulse Survey. https://www.census.gov/