
The following table shows current 30-year El Monte mortgage rates. You can use the menus to select other loan durations, alter the loan amount. or change your location.
While Arizona's climate may not appeal to everyone, the state does offer mild home prices and a low property tax rate. The Great Recession was especially bad in the Grand Canyon State, sending not only property values down, but also employment rates. Arizona still hasn't fully recovered more than a decade later, although foreclosure rates have stabilized and home prices are increasing.
Between 1998 and 2006 Arizona real estate prices appreciated at over 80% beyond the broader general rate of inflation. That rapid price rise set the state for a sharp fall.
Arizona's housing market was one of the hardest hit by the Great Recession of 2007. According to the U.S. Bureau of Labor Statistics, the construction industry for residential properties in Arizona saw a 48% decrease in unemployment as a result of the mortgage debacle. Nevada was the only state in the Union to post a larger decline. CNN reports that during the Recession, the number of foreclosures increased more than 200% in the Grand Canyon State.
Besides the construction of new homes, prices of existing properties in Arizona also took a major hit. According to CNBC, Phoenix saw a decline of 56% in home values from 2006 until 2011, when the recovery finally began, making the drop in prices one of America's largest lagging only Las Vegas.
The median home value in August of 2007 for the state was $243,000. As already noted, the current estimate is $225,00, showing that Arizona still has not completely recovered. With a tepid forecast for future growth rates, it will still be some years before the Grand Canyon State gets back to pre-Recession levels, particularly on an inflation-adjusted basis.
Phoenix was especially hard hit during the 2007-2008 economic contraction. One of America's most widely followed real estate health gauges, the S&P/Case-Shiller Phoenix Home Price Index, experienced a peak in June of 2006 at 227. This all-time high was quickly followed by a steep decline, bottoming out in May of 2009 at 104, which was more than a 50% loss in property prices. The index stuttered through 2011, where it finally reached the end at 102. The index has steadily climbed back up to 170, although this level is well below pre-Recession highs.
Other regions performed much better than Arizona during and after the real estate crisis. For example, the S&P/Case-Shiller Home Price Index for Boston saw only a 17% decline in home values during the same period. The Boston property market fully recovered in 2015 to pre-crisis levels and is still increasing.
When the recession hit, demand for the rapidly increasing stock of homes disappeared until prices fell far enough to attract foreign buyers & Wall Street investors.
Canadian vacation home buyers and hedge fund rental buyers snapped up properties at discount prices, which helped the Phoenix property market recover. As investor demand & foreign buyers have receeded, companies like Opendoor have entered the local market to try to profit from adding liquidity to the market & making it easier to sell a home quickly, though it remains to be seen how they will perform during a recession.
In 2002 homeownership across the state stood at 65.6%. During the housing boom the ownership rate jumped to a peak of 71.6% in 2006 before falling to 61.9% in 2016.
The most widely-circulated newspaper in the Grand Canyon State, The Arizona Republic, sees the greatest problem with the state's poor performance during the Recession to lie in the general economy. Too many people found themselves in the unemployment line, which led to a spike in foreclosures. The newspaper reports that foreclosures have steadily declined since 2012.
Recent consumer data shows that property prices in Arizona are slightly higher than the national average. Property experts peg the Grand Canyon State at $225,000 for its median home value. This number has increased at nearly 7% during the past 12 months through 2017, although the latest market research suggests it will appreciate at a slower 3% in the future.
The national median home value is estimated at $201,000. It has been increasing at roughly Arizona's rate, and property analysts expect it to slow down in the near future. In terms of market prices, the national average is $260,000, which produces a per-square-foot figure of roughly $140.
Real estate followers estimate the real estate market in Arizona to be very healthy; it grades the state a 7.9 out of 10 based on a variety of criteria, such as the speed it takes the average house to sell and the amount of homes with negative equity.
The median list price in the Grand Canyon State, a slightly different measure than estimated home value, is $270,000. On a per-square foot basis, this is roughly $145.
According to RealtyTrac, a company that specializes in defaulted properties in the United States, there are roughly 1,500 foreclosures in Arizona every month. On a per capita basis, this is slightly lower than the national average.
The real estate tracking site Trulia shows a heat map of the United States with median list prices. Most of the country is green, which shows moderate to low prices. A few areas are orange or red, including places such as New York, Denver, and coastal regions of California. Arizona is mostly light green, which indicates moderate, although not low, listing prices.
The popular demographics website NeighborhoodScout shows that the most common type of housing unit in Arizona is the single-family home with three bedrooms. The website estimates that over 60% of Arizonians own rather than rent, with home prices most commonly found between $131,000 and $263,000.
Through the first 3 quarters of 2020 real estate held up far better than it did during the 2008 housing recession. Central banks and politicians reacted faster and much more aggressively to the COVID-19 crisis than they did to the 2008 recession. Many novel and unconventional policies which began in response to the prior recession were used much more aggressively in this recession. For instance, here are some of the policies which were enacted:
On November 24, 2020 the Federal Housing Finance Agency (FHFA) raised conforming loan limits by 7.42%, reflecting strong annual growth in the nationwide FHFA House Price Index (HPI). 2022 and 2023 saw limit increases of 18.05% and 12.21%, the fastest 2-year growth rates since 1986 & 1987, and inline with the 15.95% growth in 2006. In 2024 and 2025 the limits were increased at more historically normal levels of 5.56% and 5.21%.
| AZ Rank | US Rank | Metropolitan Area | 2016 Pop | 2010 Pop | Change | % △ |
|---|---|---|---|---|---|---|
| 1 | 12 | Phoenix-Mesa-Scottsdale | 4,661,537 | 4,192,887 | 468,650 | 11.18% |
| 2 | 53 | Tucson | 1,016,206 | 980,263 | 35,943 | 3.67% |
| 3 | 198 | Prescott | 225,562 | 211,033 | 14,529 | 6.88% |
| 4 | 216 | Yuma | 205,631 | 195,751 | 9,880 | 5.05% |
| 5 | 218 | Lake Havasu City-Kingman | 205,249 | 200,186 | 5,063 | 2.53% |
| 6 | 298 | Flagstaff | 140,908 | 134,421 | 6,487 | 4.83% |
| 7 | 326 | Sierra Vista-Douglas | 125,770 | 131,346 | -5,576 | -4.25% |
| 8 | 355 | Show Low | 110,026 | 107,449 | 2,577 | 2.40% |
| 9 | 569 | Payson | 53,556 | 53,597 | -41 | -0.08% |
| 10 | 626 | Nogales | 45,985 | 47,420 | -1,435 | -3.03% |
| 11 | 731 | Safford | 37,599 | 37,220 | 379 | 1.02% |
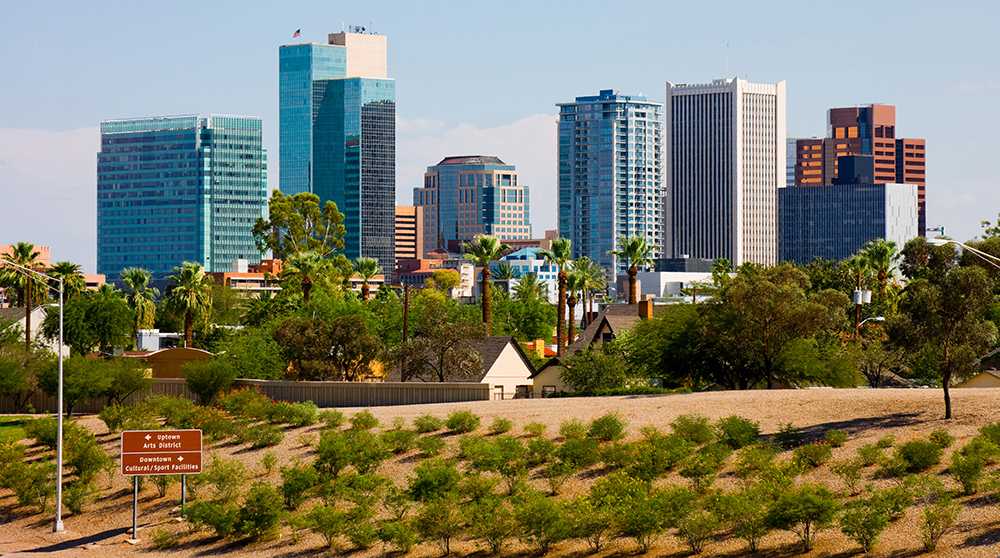
The largest city in Arizona is Phoenix, which is also the center of the state's largest metro area. Designated the Phoenix-Mesa-Scottsdale metro area by the U.S. Census Bureau, the region has a median income of roughly $56,000 and a median property value of $219,000. These figures produce a home value-to-income ratio of 3.9, which is a little high, but lower than other regions of the country. Fresno, California, for example, has a ratio of around 5.0.
As the city at the center of the nation's twelfth largest metro area, Phoenix has professional teams in every major sport, scenic desert hiking trails, impressive golf courses, world class museums and a variety of authentic ethic restaurants.
Property followers describe the Phoenix real estate market as cold, which means it's a buyers' market. The city has a median list price of $279,000 for a single-family detached home, while the typical condo is on the market for $189,000.
The Phoenix economy is driven by technology and tourism. Clean high tech industry employers including Intel, Honeywell and Raytheon make the Phoenix area a growing center for well paying high tech jobs in engineering, research and manufacturing.
Sports fans can enjoy professional sports year-round. Pro baseball, basketball and football teams are based in the city in the Diamondbacks, Suns & Cardinals.
Although the area's summer climate is rather abysmal, it does receive significant inflows of tourist dollars during the winter months. According to Forbes magazine, the cost of living is above the national average.
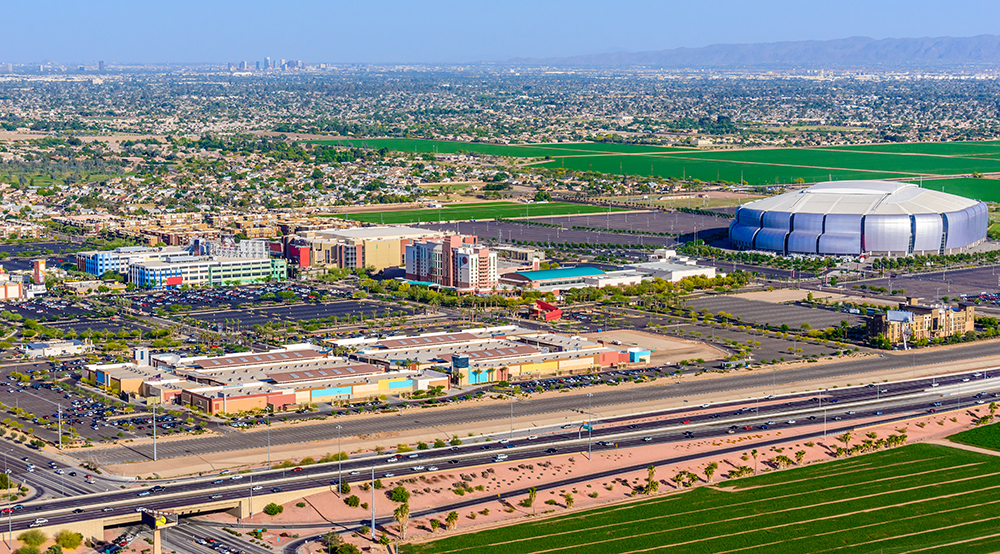
Surrounded by many suburban communities, the Phoenix metropolitan area has upscale cities such as Scottsdale, Glendale and Paradise Valley as well as numerous master planned communities in both the East and West Valley.
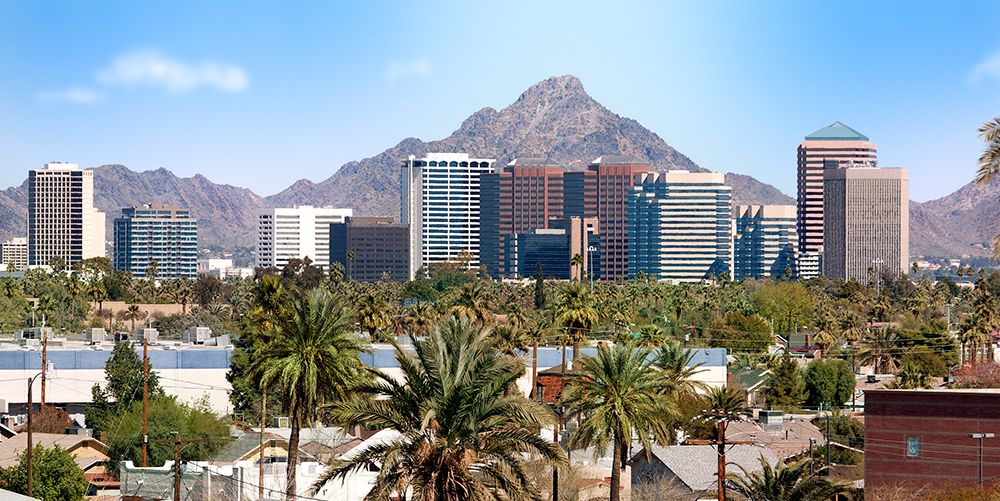
Scottsdale, which is located in the Phoenix metro area, is the most expensive city in the state.
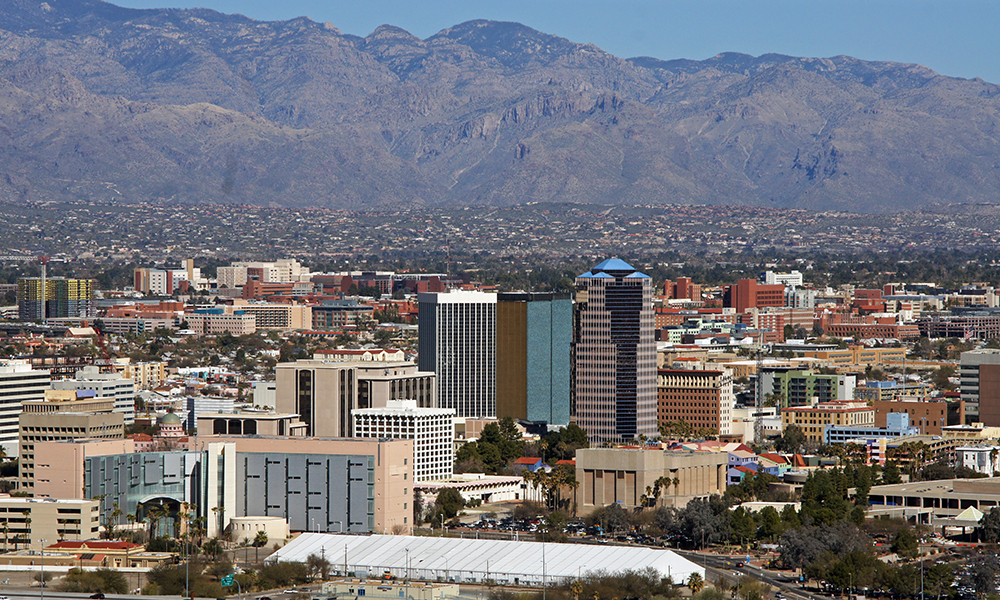
Some of the lowest real estate prices in Arizona can be found in Tucson, which paradoxically has better weather than more expensive Phoenix. About a two hour trip down Interstate 10 from Phoenix is the city of Tucson. Located in the lush Sonoran desert, Tucson's higher elevation and greater rainfall allows for a variety of unusual and exotic plants, shrubs and trees.
Real estate professionals estimate the median home value for Tucson to be quite low at $173,000 while the typical three-bedroom house to estimated to list for roughly $190,000. By comparison, the national average list price for the same size house is $229,000. The U.S. Census Bureau calculates the median income in the area to be just south of $38,000. Judged against a median home value of $173,000 produces a ratio of 4.6, which is slightly above Phoenix.
Major employers in the area include a local air force base and the University of Arizona. Private sector companies that provide jobs include Honeywell Aerospace, IBM, and Texas Instruments. According to Tucson's municipal government, tourism contributes $1.8 billion to the local economy.
Tucson is surrounded by the Rincon, Santa Rita and Catalina mountains, and is truly an outdoor recreational oasis. The Saguaro National Park is within close proximity and offers numerous hiking trails, waterfalls and exposure to desert wildlife and vegetation. The Sonoran Desert Museum is one of the highest rated exotic zoo's in the country including everything from Gila Monsters to limestone caves.

Neighborhoods in metropolitan Tucson provide every style of living from the retirement communities in Green Valley, the family friendly suburb of Oro Valley, to the affluent neighborhoods of the Foothills community.
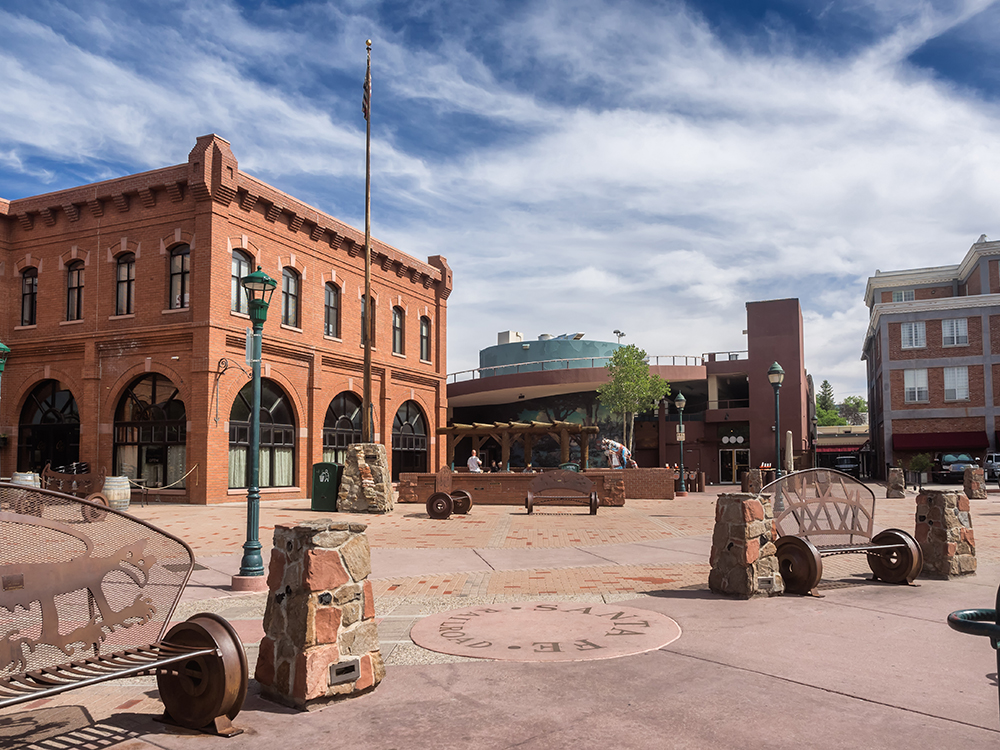
Other prominent cities in Arizona include Flagstaff, which is 2 hours north of Phoenix in the Ponderosa pines. Flagstaff is the home of Northern Arizona University and has homes for both year round residents as well as second homes for those desert dwellers looking for an escape from the summer heat.
Similarly, in the northeast quadrant of the state is the White Mountains, a collection of communities including Show Low, Pinetop, Lakeside and several other small towns nestled in the tall pines. This area enjoys moderate temperatures all year, skiing in the winter and boating in the summer. It is a popular inexpensive vacation spot for residents from all around the state.
The fastest growing city in the Grand Canyon State is Buckeye. It is located just 40 minutes west of downtown Phoenix. Like its municipal mother, it has a fairly hot desert climate; but unlike Phoenix, it has a much lower crime rate.
As of July 1, 2016 the state of Arizona has an estimated population of 6,931,071 across 113594.08 mi² yielding a population density of 61.02 people per mi² across the state.
The following table highlights the July 1, 2016 populations of cities, towns & Census Designated Places (CDP) with over 3,000 residents based on United States Census Bureau estimates. For Census Designated Places (CDP) where there was no population estimate available for 2016, the 2011-2015 American Community Survey 5-Year Estimates data was used.
All table columns are sortable. Click on the column headers to sort by that column. Click again to sort low to high. Cities with higher levels of population growth typically see the increased demand drive faster real estate price appreciation.
| Rank | Geography | County | 2016 Pop | 2010 Pop | Change | % △ | Land mi² | Density mi² |
|---|---|---|---|---|---|---|---|---|
| 1 | Phoenix | Maricopa | 1,615,017 | 1,445,632 | 169,385 | 11.72% | 516.7 | 3,125.64 |
| 2 | Tucson | Pima | 530,706 | 520,116 | 10,590 | 2.04% | 226.71 | 2,340.90 |
| 3 | Mesa | Maricopa | 484,587 | 439,041 | 45,546 | 10.37% | 136.45 | 3,551.39 |
| 4 | Chandler | Maricopa | 247,477 | 236,123 | 11,354 | 4.81% | 64.41 | 3,842.21 |
| 5 | Scottsdale | Maricopa | 246,645 | 217,385 | 29,260 | 13.46% | 183.92 | 1,341.05 |
| 6 | Glendale | Maricopa | 245,895 | 226,721 | 19,174 | 8.46% | 59.98 | 4,099.62 |
| 7 | Gilbert | Maricopa | 237,133 | 208,453 | 28,680 | 13.76% | 67.96 | 3,489.30 |
| 8 | Tempe | Maricopa | 182,498 | 161,719 | 20,779 | 12.85% | 39.93 | 4,570.45 |
| 9 | Peoria | Maricopa & Yavapai | 164,173 | 154,065 | 10,108 | 6.56% | 174.4 | 941.36 |
| 10 | Surprise | Maricopa | 132,677 | 117,517 | 15,160 | 12.90% | 105.75 | 1,254.63 |
| 11 | Yuma | Yuma | 94,906 | 93,064 | 1,842 | 1.98% | 120.28 | 789.04 |
| San Tan Valley CDP | Pinal | 87,923 | 81,321 | 6,602 | 8.12% | 35.78 | 2,457.32 | |
| 12 | Avondale | Maricopa | 82,881 | 76,238 | 6,643 | 8.71% | 45.6 | 1,817.57 |
| 13 | Goodyear | Maricopa | 77,258 | 65,275 | 11,983 | 18.36% | 191.48 | 403.48 |
| 14 | Flagstaff | Coconino | 71,459 | 65,870 | 5,589 | 8.48% | 63.87 | 1,118.82 |
| Casas Adobes CDP | Pima | 68,862 | 66,795 | 2,067 | 3.09% | 26.75 | 2,574.28 | |
| 15 | Buckeye | Maricopa | 64,629 | 50,876 | 13,753 | 27.03% | 375.26 | 172.22 |
| 16 | Casa Grande | Pinal | 54,534 | 48,571 | 5,963 | 12.28% | 109.67 | 497.26 |
| 17 | Lake Havasu City | Mohave | 53,743 | 52,527 | 1,216 | 2.31% | 44.43 | 1,209.61 |
| Catalina Foothills CDP | Pima | 50,940 | 50,796 | 144 | 0.28% | 42.01 | 1,212.57 | |
| 18 | Maricopa | Pinal | 46,903 | 43,482 | 3,421 | 7.87% | 47.47 | 988.06 |
| 19 | Oro Valley | Pima | 43,781 | 41,011 | 2,770 | 6.75% | 35.53 | 1,232.23 |
| 20 | Marana | Pima & Pinal | 43,474 | 34,961 | 8,513 | 24.35% | 121.47 | 357.90 |
| 21 | Sierra Vista | Cochise | 43,208 | 43,888 | -680 | -1.55% | 152.27 | 283.76 |
| 22 | Prescott Valley | Yavapai | 43,132 | 38,822 | 4,310 | 11.10% | 38.65 | 1,115.96 |
| 23 | Prescott | Yavapai | 42,513 | 39,843 | 2,670 | 6.70% | 41.34 | 1,028.37 |
| 24 | Bullhead City | Mohave | 39,970 | 39,540 | 430 | 1.09% | 59.38 | 673.12 |
| 25 | Apache Junction | Pinal & Maricopa | 39,954 | 35,840 | 4,114 | 11.48% | 34.99 | 1,141.87 |
| Sun City CDP | Maricopa | 39,111 | 37,499 | 1,612 | 4.30% | 14.36 | 2,723.61 | |
| 26 | Queen Creek | Maricopa & Pinal | 35,524 | 26,361 | 9,163 | 34.76% | 28.04 | 1,266.90 |
| 27 | El Mirage | Maricopa | 35,043 | 31,797 | 3,246 | 10.21% | 10.03 | 3,493.82 |
| 28 | San Luis | Yuma | 32,148 | 25,505 | 6,643 | 26.05% | 32.03 | 1,003.68 |
| 29 | Kingman | Mohave | 29,029 | 28,068 | 961 | 3.42% | 34.82 | 833.69 |
| 30 | Sahuarita | Pima | 28,794 | 25,259 | 3,535 | 14.00% | 31.04 | 927.64 |
| Drexel Heights CDP | Pima | 28,233 | 27,749 | 484 | 1.74% | 20.2 | 1,397.67 | |
| Fortuna Foothills CDP | Yuma | 27,487 | 26,265 | 1,222 | 4.65% | 40.17 | 684.27 | |
| 31 | Florence | Pinal | 25,779 | 25,536 | 243 | 0.95% | 52.45 | 491.50 |
| 32 | Fountain Hills | Maricopa | 24,482 | 22,489 | 1,993 | 8.86% | 20.33 | 1,204.23 |
| Sun City West CDP | Maricopa | 24,338 | 24,535 | -197 | -0.80% | 10.93 | 2,226.72 | |
| Anthem CDP | Maricopa | 22,995 | 21,700 | 1,295 | 5.97% | 7.98 | 2,881.58 | |
| Green Valley CDP | Pima | 22,419 | 21,391 | 1,028 | 4.81% | 32.24 | 695.38 | |
| 33 | Nogales | Santa Cruz | 20,008 | 20,837 | -829 | -3.98% | 20.82 | 961.00 |
| Rio Rico CDP | Santa Cruz | 18,760 | 18,962 | -202 | -1.07% | 62.26 | 301.32 | |
| 34 | Eloy | Pinal | 17,442 | 16,631 | 811 | 4.88% | 111.51 | 156.42 |
| Tanque Verde CDP | Pima | 16,748 | 16,901 | -153 | -0.91% | 32.98 | 507.82 | |
| 35 | Douglas | Cochise | 16,604 | 17,378 | -774 | -4.45% | 9.98 | 1,663.73 |
| Flowing Wells CDP | Pima | 16,078 | 16,419 | -341 | -2.08% | 4.02 | 3,999.50 | |
| 36 | Payson | Gila | 15,476 | 15,301 | 175 | 1.14% | 19.47 | 794.86 |
| New River CDP | Maricopa | 15,289 | 14,952 | 337 | 2.25% | 55.75 | 274.24 | |
| Sierra Vista Southeast CDP | Cochise | 15,128 | 14,797 | 331 | 2.24% | 110.9 | 136.41 | |
| 37 | Somerton | Yuma | 14,970 | 14,287 | 683 | 4.78% | 7.29 | 2,053.50 |
| Sun Lakes CDP | Maricopa | 14,378 | 13,975 | 403 | 2.88% | 5.32 | 2,702.63 | |
| 38 | Paradise Valley | Maricopa | 14,355 | 12,820 | 1,535 | 11.97% | 15.43 | 930.33 |
| Fort Mohave CDP | Mohave | 13,686 | 14,364 | -678 | -4.72% | 16.7 | 819.52 | |
| Verde Village CDP | Yavapai | 12,532 | 11,605 | 927 | 7.99% | 6.98 | 1,795.42 | |
| 39 | Coolidge | Pinal | 12,528 | 11,825 | 703 | 5.95% | 56.49 | 221.77 |
| Tucson Estates CDP | Pima | 12,079 | 12,192 | -113 | -0.93% | 13 | 929.15 | |
| 40 | Cottonwood | Yavapai | 11,990 | 11,265 | 725 | 6.44% | 16.41 | 730.65 |
| New Kingman-Butler CDP | Mohave | 11,859 | 12,134 | -275 | -2.27% | 4.97 | 2,386.12 | |
| 41 | Chino Valley | Yavapai | 11,250 | 10,817 | 433 | 4.00% | 63.37 | 177.53 |
| 42 | Camp Verde | Yavapai | 11,238 | 10,873 | 365 | 3.36% | 43.14 | 260.50 |
| Vail CDP | Pima | 11,143 | 10,208 | 935 | 9.16% | 22.66 | 491.75 | |
| 43 | Show Low | Navajo | 11,096 | 10,660 | 436 | 4.09% | 40.94 | 271.03 |
| 44 | Sedona | Yavapai & Coconino | 10,397 | 10,031 | 366 | 3.65% | 19.14 | 543.21 |
| Valencia West CDP | Pima | 10,331 | 9,355 | 976 | 10.43% | 10.44 | 989.56 | |
| Saddlebrooke CDP | Pinal | 9,790 | 9,614 | 176 | 1.83% | 29.29 | 334.24 | |
| Tuba City CDP | Coconino | 9,772 | 8,611 | 1,161 | 13.48% | 8.97 | 1,089.41 | |
| 45 | Winslow | Navajo | 9,754 | 9,655 | 99 | 1.03% | 12.3 | 793.01 |
| 46 | Safford | Graham | 9,604 | 9,566 | 38 | 0.40% | 8.56 | 1,121.96 |
| Gold Canyon CDP | Pinal | 9,597 | 10,159 | -562 | -5.53% | 22.39 | 428.63 | |
| Arizona City CDP | Pinal | 8,969 | 10,475 | -1,506 | -14.38% | 6.11 | 1,467.92 | |
| Golden Valley CDP | Mohave | 8,946 | 8,370 | 576 | 6.88% | 78.74 | 113.61 | |
| Picture Rocks CDP | Pima | 8,666 | 9,563 | -897 | -9.38% | 70.87 | 122.28 | |
| 47 | Page | Coconino | 7,599 | 7,247 | 352 | 4.86% | 16.63 | 456.95 |
| Catalina CDP | Pima | 7,456 | 7,569 | -113 | -1.49% | 14.11 | 528.42 | |
| 48 | Globe | Gila | 7,376 | 7,532 | -156 | -2.07% | 18.18 | 405.72 |
| 49 | Tolleson | Maricopa | 7,178 | 6,545 | 633 | 9.67% | 5.75 | 1,248.35 |
| 50 | Wickenburg | Maricopa & Yavapai | 7,115 | 6,363 | 752 | 11.82% | 18.76 | 379.26 |
| Corona de Tucson CDP | Pima | 7,023 | 5,675 | 1,348 | 23.75% | 6.09 | 1,153.20 | |
| 51 | Youngtown | Maricopa | 6,759 | 6,156 | 603 | 9.80% | 1.53 | 4,417.65 |
| 52 | Guadalupe | Maricopa | 6,336 | 5,523 | 813 | 14.72% | 0.81 | 7,822.22 |
| Village of Oak Creek (Big Park) CDP | Yavapai | 6,336 | 6,147 | 189 | 3.07% | 5.26 | 1,204.56 | |
| Lake Montezuma CDP | Yavapai | 5,970 | 4,706 | 1,264 | 26.86% | 12.03 | 496.26 | |
| Doney Park CDP | Coconino | 5,944 | 5,395 | 549 | 10.18% | 14.96 | 397.33 | |
| 53 | Litchfield Park | Maricopa | 5,766 | 5,476 | 290 | 5.30% | 3.31 | 1,741.99 |
| 54 | Snowflake | Navajo | 5,764 | 5,590 | 174 | 3.11% | 33.52 | 171.96 |
| 55 | South Tucson | Pima | 5,645 | 5,652 | -7 | -0.12% | 1.04 | 5,427.88 |
| Williamson CDP | Yavapai | 5,531 | 5,438 | 93 | 1.71% | 56.92 | 97.17 | |
| 56 | Cave Creek | Maricopa | 5,476 | 5,015 | 461 | 9.19% | 37.91 | 144.45 |
| 57 | Bisbee | Cochise | 5,221 | 5,575 | -354 | -6.35% | 5.16 | 1,011.82 |
| Rincon Valley CDP | Pima | 5,103 | 5,139 | -36 | -0.70% | 27.83 | 183.36 | |
| Summit CDP | Pima | 5,097 | 5,372 | -275 | -5.12% | 4.49 | 1,135.19 | |
| 58 | Holbrook | Navajo | 5,074 | 5,053 | 21 | 0.42% | 17.34 | 292.62 |
| Three Points CDP | Pima | 5,033 | 5,581 | -548 | -9.82% | 46.42 | 108.42 | |
| 59 | Thatcher | Graham | 5,027 | 4,865 | 162 | 3.33% | 6.71 | 749.18 |
| 60 | Eagar | Apache | 4,988 | 4,885 | 103 | 2.11% | 11.23 | 444.17 |
| Chinle CDP | Apache | 4,947 | 4,518 | 429 | 9.50% | 16.03 | 308.61 | |
| 61 | Benson | Cochise | 4,870 | 5,105 | -235 | -4.60% | 41.41 | 117.60 |
| 62 | Colorado City | Mohave | 4,818 | 4,821 | -3 | -0.06% | 10.33 | 466.41 |
| Whiteriver CDP | Navajo | 4,766 | 4,104 | 662 | 16.13% | 15.67 | 304.15 | |
| Avra Valley CDP | Pima | 4,736 | 6,050 | -1,314 | -21.72% | 22.19 | 213.43 | |
| Kayenta CDP | Navajo | 4,702 | 5,189 | -487 | -9.39% | 13.17 | 357.02 | |
| Citrus Park CDP | Maricopa | 4,451 | 4,028 | 423 | 10.50% | 5.79 | 768.74 | |
| 63 | Pinetop-Lakeside | Navajo | 4,378 | 4,282 | 96 | 2.24% | 11.29 | 387.78 |
| Lake of the Woods CDP | Navajo | 4,363 | 4,094 | 269 | 6.57% | 3.97 | 1,098.99 | |
| San Carlos CDP | Gila | 4,314 | 4,038 | 276 | 6.84% | 8.58 | 502.80 | |
| Paulden CDP | Yavapai | 4,277 | 5,231 | -954 | -18.24% | 57.06 | 74.96 | |
| 64 | Clarkdale | Yavapai | 4,272 | 4,097 | 175 | 4.27% | 10.42 | 409.98 |
| 65 | Taylor | Navajo | 4,217 | 4,112 | 105 | 2.55% | 32.65 | 129.16 |
| 66 | Dewey-Humboldt | Yavapai | 4,049 | 3,894 | 155 | 3.98% | 18.59 | 217.81 |
| San Manuel CDP | Pinal | 4,028 | 3,551 | 477 | 13.43% | 20.72 | 194.40 | |
| Fort Defiance CDP | Apache | 4,005 | 3,624 | 381 | 10.51% | 6.1 | 656.56 | |
| Ajo CDP | Pima | 3,886 | 3,304 | 582 | 17.62% | 33.33 | 116.59 | |
| Avenue B and C CDP | Yuma | 3,798 | 4,176 | -378 | -9.05% | 0.74 | 5,132.43 | |
| Oracle CDP | Pinal | 3,756 | 3,686 | 70 | 1.90% | 16.41 | 228.88 | |
| 67 | Clifton | Greenlee | 3,734 | 3,311 | 423 | 12.78% | 14.6 | 255.75 |
| 68 | Carefree | Maricopa | 3,724 | 3,363 | 361 | 10.73% | 8.8 | 423.18 |
| 69 | Quartzsite | La Paz | 3,644 | 3,677 | -33 | -0.90% | 36.72 | 99.24 |
| 70 | St. Johns | Apache | 3,568 | 3,480 | 88 | 2.53% | 25.91 | 137.71 |
| 71 | Willcox | Cochise | 3,511 | 3,757 | -246 | -6.55% | 6.15 | 570.89 |
| Swift Trail Junction CDP | Graham | 3,323 | 2,935 | 388 | 13.22% | 3.67 | 905.45 | |
| Window Rock CDP | Apache | 3,255 | 2,712 | 543 | 20.02% | 5.28 | 616.48 | |
| 72 | Williams | Coconino | 3,159 | 3,023 | 136 | 4.50% | 43.45 | 72.70 |
| Central Heights-Midland City CDP | Gila | 3,030 | 2,534 | 496 | 19.57% | 1.94 | 1,561.86 | |
| 73 | Parker | La Paz | 3,026 | 3,083 | -57 | -1.85% | 21.98 | 137.67 |
Annual Estimates of the Resident Population: April 1, 2010 to July 1, 2016
Source: U.S. Census Bureau, Population Division
Release Date: May 2017.
Arizonians have several mortgage choices available to them. Fixed-rate and adjustable-rate mortgages are both available in a variety of terms. The most popular home loan in the Grand Canyon State is the 30-year fixed-rate loan. It is the most commonly-used mortgage because it offers the lowest monthly payments. Although shorter terms, such as a 15-year or 10-year variety, are available, they result in higher monthly payments, although with lower interest rates & total interest cost.
Unlike the fixed-rate loan, which has an APR that does not fluctuate, the adjustable-rate loan has a rate that varies—hence the term adjustable. These mortgages offer a rate that is fixed for a certain number of years (usually 3, 5, 7, or 10), and then the APR can change once per year for the remaining term of the mortgage. Balloon loans are similar to ARM loans, but they are required repayment in full or refinancing at a fixed date.
Banks that provide these loans generally require a 20% down payment and debt-to income ratios of 40% or less. These conditions apply to any credit score, although mortgage underwriters will consider multiple factors on a loan application.
The piggyback loan is another type of mortgage available to Arizona residents. This is simply two mortgages in one. The piggyback loan can eliminate the need for private mortgage insurance by covering 80% of the home's value with the first loan, while the second loan helps to pay for part of the down payment. This mortgage is a good way to avoid the standard 20% down payment, which is required by most private banks.
Most of the state's real estate is quite affordable, but home buyers in Scottsdale may need to obtain jumbo mortgages, which exceed the conforming limit. As of 2025 the conforming loan limit across the United States is set to $806,500, with a ceiling of 150% that amount in areas where median home values are higher. The $806,500 limit applies to single family homes statewide. The limits for 2, 3 & 4 unit dwellings are: $1,032,650, $1,248,150, & $1,551,250.
Jumbo loans typically have a slightly higher rate of interest than conforming mortgages, which varies based on credit market conditions.

Borrowers who can't meet the 20% down payment requirement might find some assistance from the government. The Federal Housing Administration offers loans that require just a 3.5% down payment; and FHA loans only require a 580 credit score. FHA mortgages are also offered for borrowers with lower scores, although the required down payment goes up to 10%. With either loan option, the FHA does require insurance premiums because the down payment is under 20%.
For former members of the U.S. military, the Veterans Administration provides an unbeatable deal by offering mortgages with zero down payment required. There is a funding fee for veterans who choose this option, however. It is between 1.25% and 3.3% of the loan's value. Borrowers who choose to make a down payment are offered a lower funding fee. VA loans are underwritten by private banks, and insured by the U.S. government.
USDA loans can help people with low incomes in rural parts of the state qualify for a subsidized low-interest loan.
Housing assistance is available in the Grand Canyon State under the federal government's Section 8 program. It is only available in Yavapai County, however. There is a limited number of people who can qualify, and Arizona's program may have a waiting list.
Prospective home buyers who can't get on the list or don't otherwise want to wait should check out Arizona's HOME Plus program, which provides assistance to renters with good credit who can't afford closing costs or a down payment. It is managed by the state's Industrial Development Authority.
Arizona has a moderate to high earthquake risk. Standard rental and homeowner insurance policies typically do not cover earthquake damage, though they usually cover losses caused by fires which resulted from an earthquake. You can supplement your homeowner's insurance with an earthquake policy.
Homeowner's insurance policies typically do not cover flooding. While the desert is known for being dry, some areas of the state sometimes have flash flooding. The southeastern portion of the state is considered to have a high to very high flooding risk, while Phoenix has a high risk and Tucson has a moderate risk.
Much of the state has a low flooding risk. Some counties have higher risk of flooding.
Home buyers with mortgages in high-risk areas are required to buy flood insurance. Most flood insurance policies are sold by the United States federal government through The National Flood Insurance Program. Under-priced flood insurance in high-risk areas act as a subsidy to wealthy homeowners.
“The NFIP does not charge nearly enough to cover the expected costs of its liabilities. The assessments are not sufficient to build any buffer to cover an extraordinary year, such as what occurred with Hurricane Katrina in 2005 or Hurricane Sandy in 2012. Because homeowners don't incur the full cost of building in a flood zone we end up with more houses there than if homeowners incurred the full cost of the flood risk, which exacerbates the government's costs in the next disaster.”
Homeowners who live in lower risk areas & are not required to purchase flood insurance heavily cross-subsidize homeowners who are in areas where floods are more common.
The risk of wildfires is considered moderate to very high across much of the state. Fire damages from wildfires & other types of fires are typically covered in most homeowner's insurance policies. If you own expensive items you may want to keep an up-to-date household inventory list which lists specific valuables, such as fine art & jewelry.

In 2012, a majority of Arizona voters approved a constitutional amendment that limited growth in property taxes to 5% annually and created a property tax system using Limited Property Value (LPV). Under this system, the LPV cannot exceed the full cash value of the home, which is basically the market value. The assessed value, upon which the property tax is based, is equal to 10% of LPV.
Property taxes in Arizona are levied at the local level. On average, residents of the state pay 0.68% of a home's market value in property taxes. This figure is below the national average of 1.24%. Because property tax rates vary by local area, different counties and cities have slightly different rates. Residents of Maricopa County, which contains the Phoenix metro area, pay 80 basis points on average; while Pinal County has the state's highest rate at 1.10%. The average annual property tax bill in the state is $1,918. In Tucson the average annual assessment is $2,437.
Arizona is a community property state. This means that all property purchased during a marriage with money earned by both spouses belongs to them equally. In this situation, it doesn't matter whose name is on the mortgage.
VA and FHA loans require credit reports of both spouses in community property states during the mortgage application process. These two governmental agencies also consider debts from a non-borrowing spouse when calculating debt-to-income ratios. Private lenders, too, will need debt and income information from a non-borrowing spouse in Arizona.
Mortgages in the Grand Canyon State are non-recourse loans. This means that if you default on the loan, the lender can only pursue the collateral that was included in the original agreement. Typically, this is the home itself. The lender cannot pursue other assets, such as bank or brokerage accounts.
Foreclosures in Arizona can be either judicial or nonjudicial. Most are nonjudicial because this process is quicker and cheaper. In a nonjudicial foreclosure, a trustee rather than a court is responsible for auctioning off a house that has defaulted on its loan. Under state law, a lender can sue a borrower through a deficiency judgment if a home's sale price during a foreclosure isn't enough to cover the mortgage balance, although state statutes put limits on this procedure.
Phoenix has the most vibrant economy in the state, so it naturally will have the most active property market. But it also has very hot summers, typically producing up to six months of 100° weather. Salaries in Phoenix and elsewhere do a mediocre job of justifying local real estate prices, although the state's dry climate eliminates the need to mow grass and lends itself nicely to stucco siding.
For more information on the property market in Arizona, take a look at the following helpful resources:
The Federal Reserve has begun lowering interest rates. Lock in today's low rates and save on your loan.
Are you paying too much for your mortgage?
Check your mortgage options with a trusted El Monte lender.
Answer a few questions below and connect with a lender who can help save you money today!