
The following table shows the rates for ARM loans which reset after the first year. If no results are shown or you would like to compare the rates against other introductory periods you can use the products menu to select rates on loans that reset after 3, 5, 7 or 10 years. By default refinance loans are displayed. Clicking on the purchase button displays current purchase rates.
The following table shows current 30-year mortgage rates available in New York. You can use the menus to select other loan durations, alter the loan amount, or change your location.
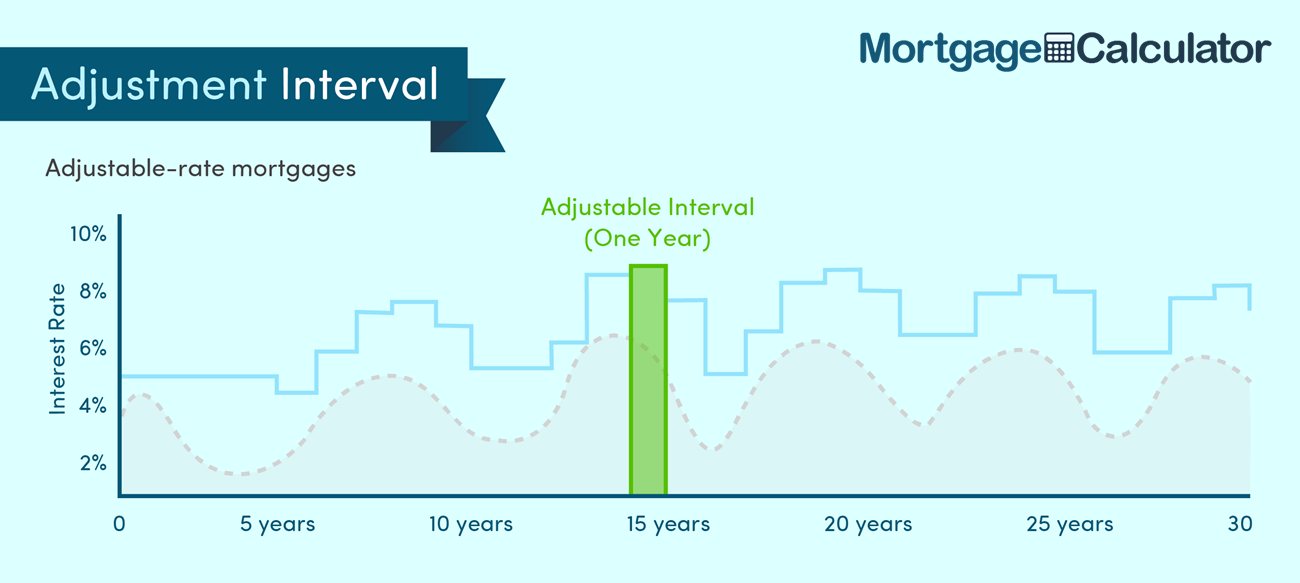
Adjustable-rate loans get their name from the fact that the rate of interest adjusts throughout the duration of the loan.
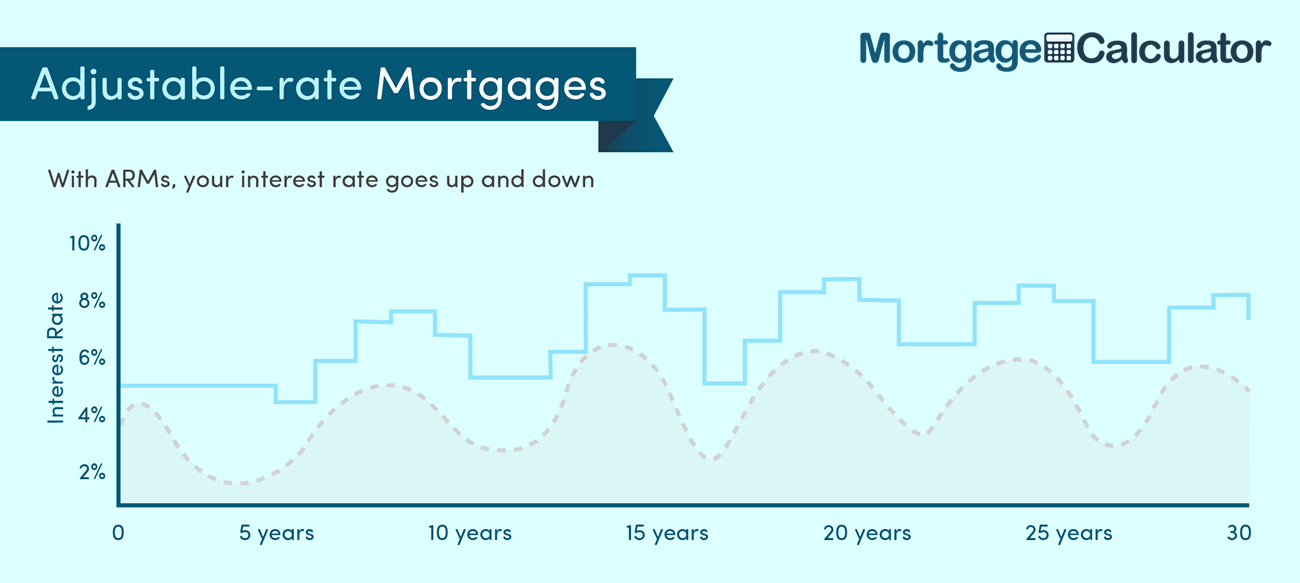
While fixed-rate mortgages are far more popular in the United States than ARMs, most developed markets like the UK, Ireland, Canada, Australia, New Zealand & Hong Kong typically lend primarily via adjustable or variable rates.
ARM loans in the United States are typically structured over 30 years, though there are also 15-year options.

Calculate Monthly ARM & Fixed Rate Loan Payments
Calculate ARMs, IO ARMs, or compare fixed, adjustable & interest-only side by side.
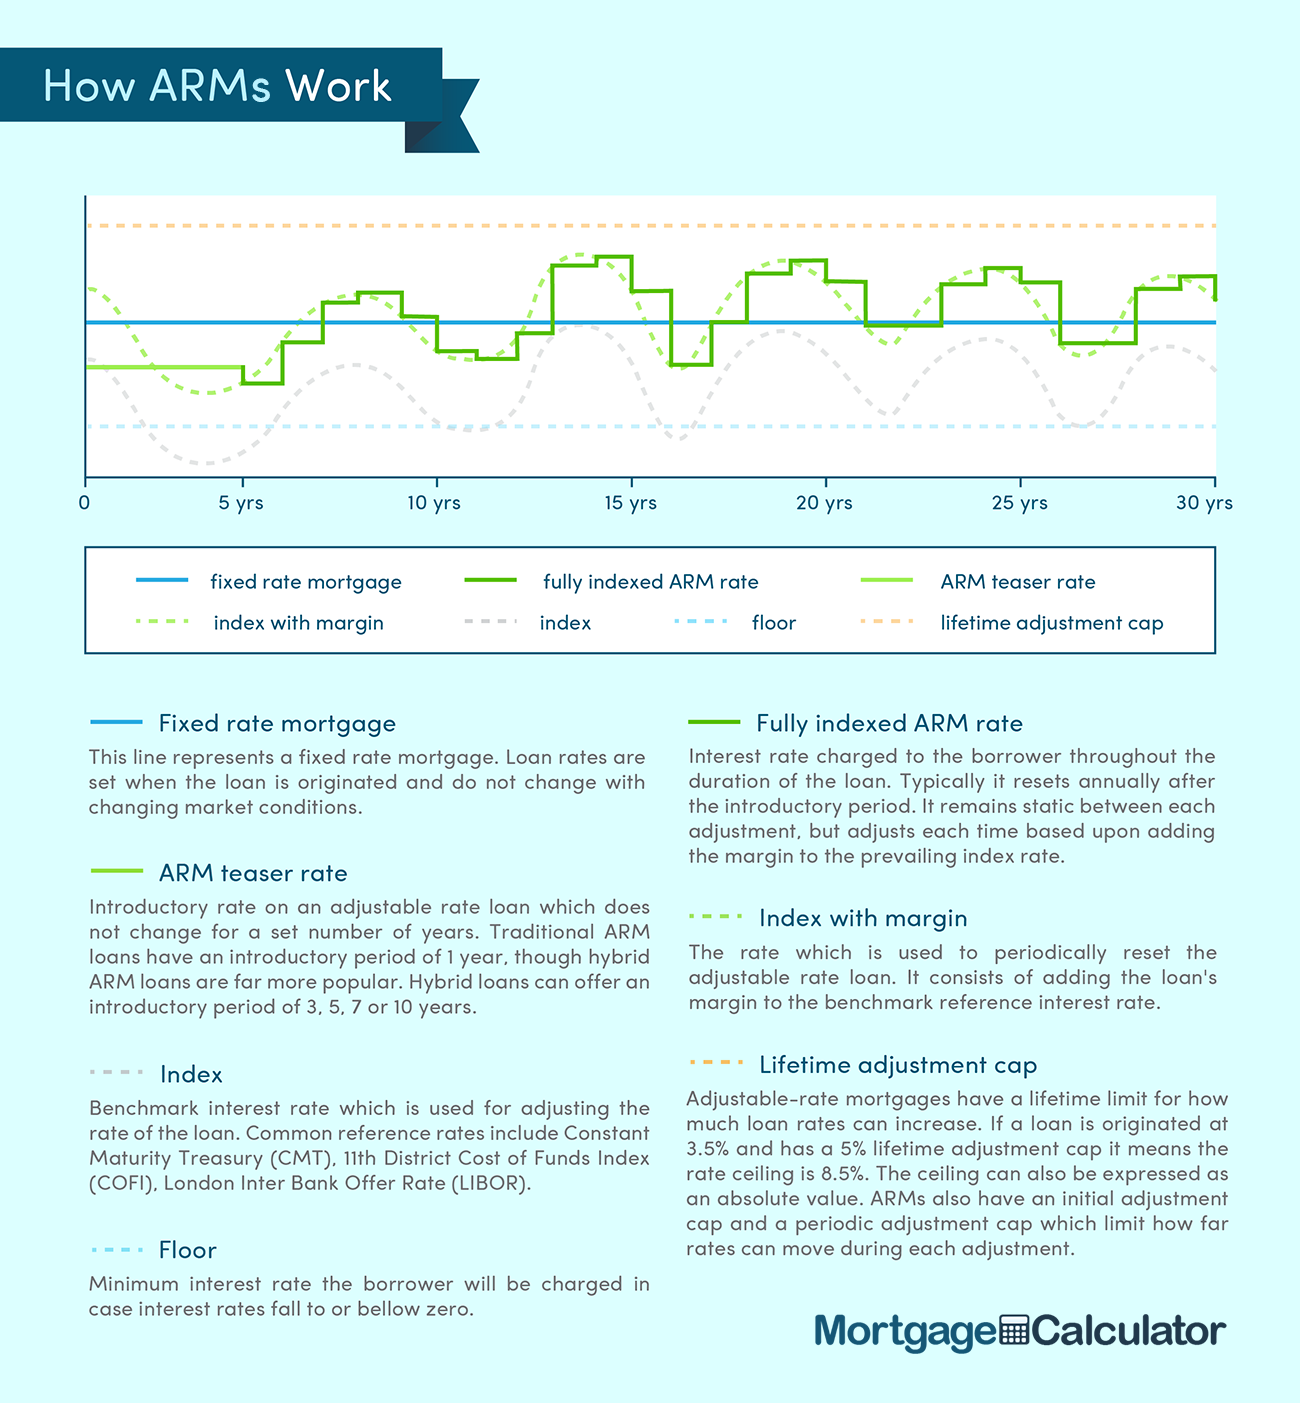
This graphic breaks down ARM loans by comparing them against fixed rate loans.
It has a lot of information in a single graphic, so we also offer other graphics below which help break down the concepts into discrete units.
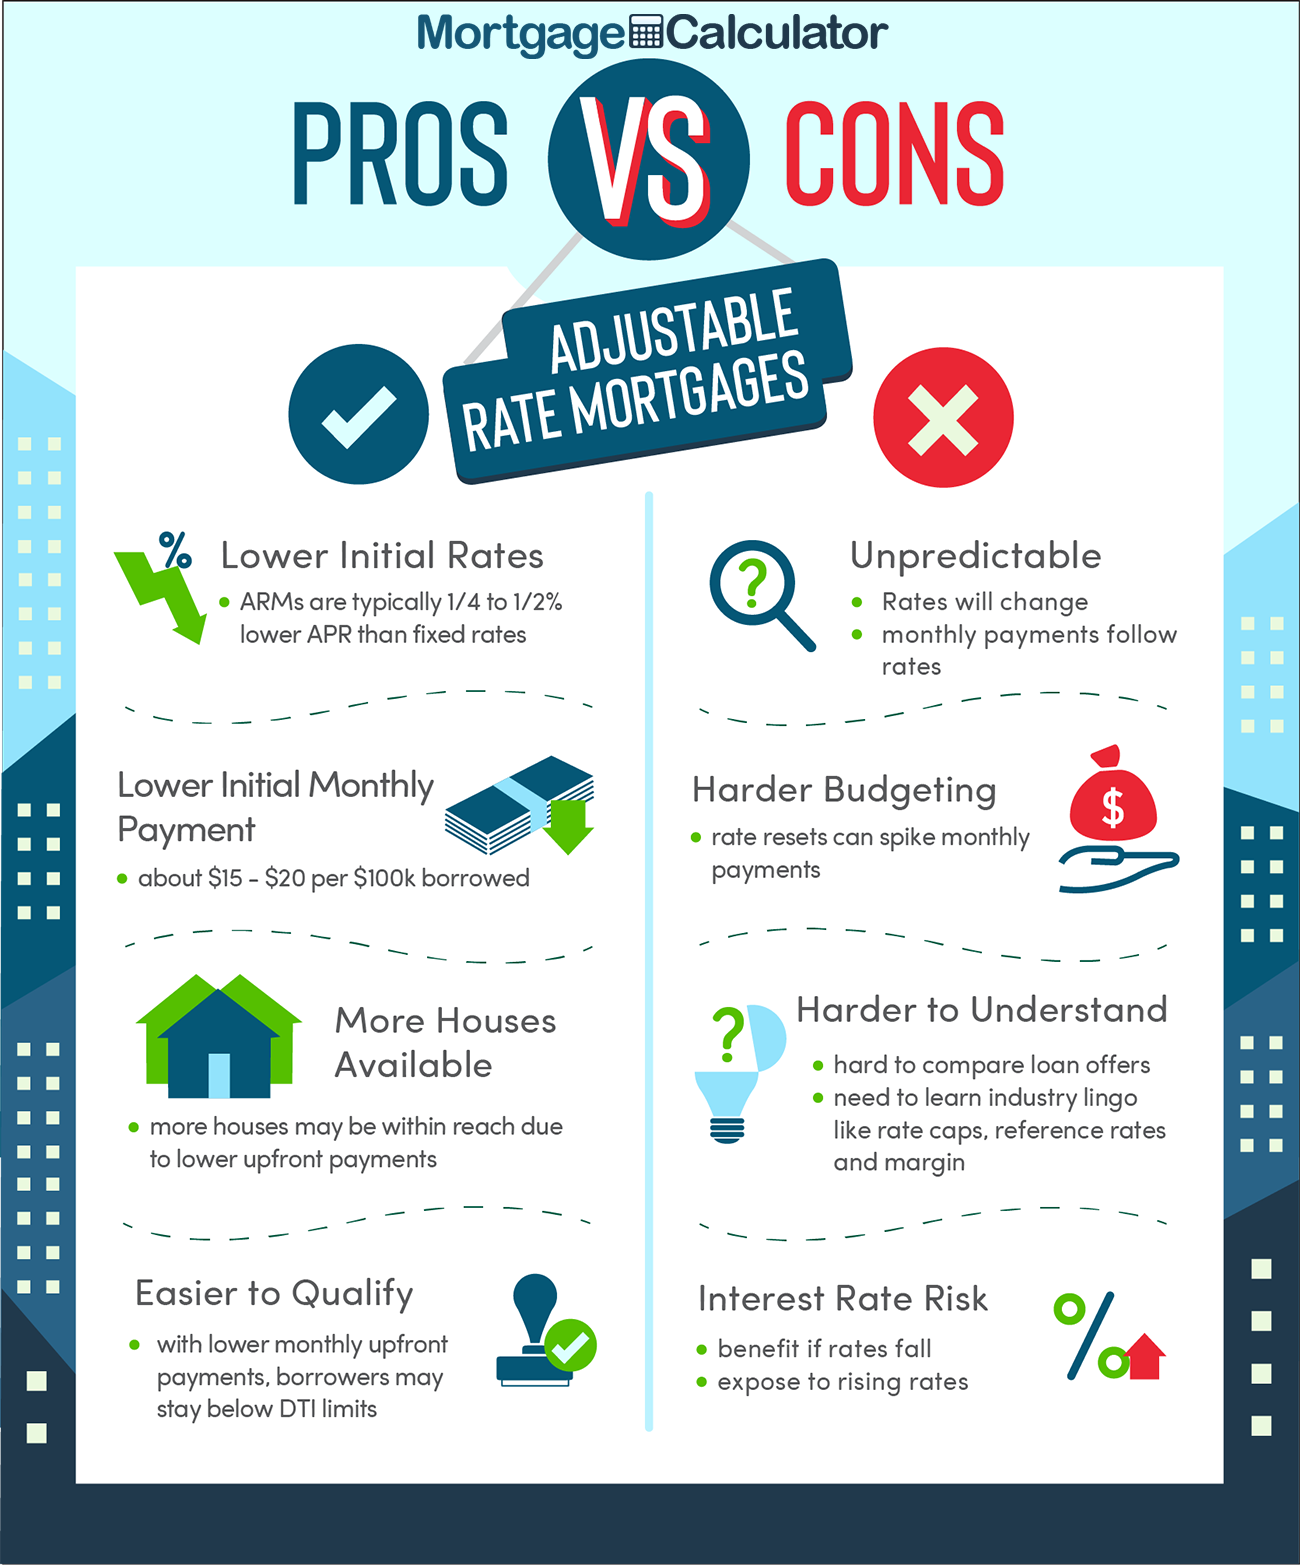
The following graphic shows some of the pros and cons of an adjustable-rate mortgage when compared against a traditional fixed-rate mortgage.
Loans can use the same number or different numbers for the initial adjustment & periodic reset.
In some cases where interest-rate caps prevent your loan from moving as much as the underlying index moved the lender may carryover the portion of the rate move which was not applied that year into subsequent years. For example, if rates increase 3% but your periodic cap only allows them to raise the loan a maximum of 2%, the additionl 1% could be applied to the rate adjustment the following year even if the referenced index rate does not increase that year.
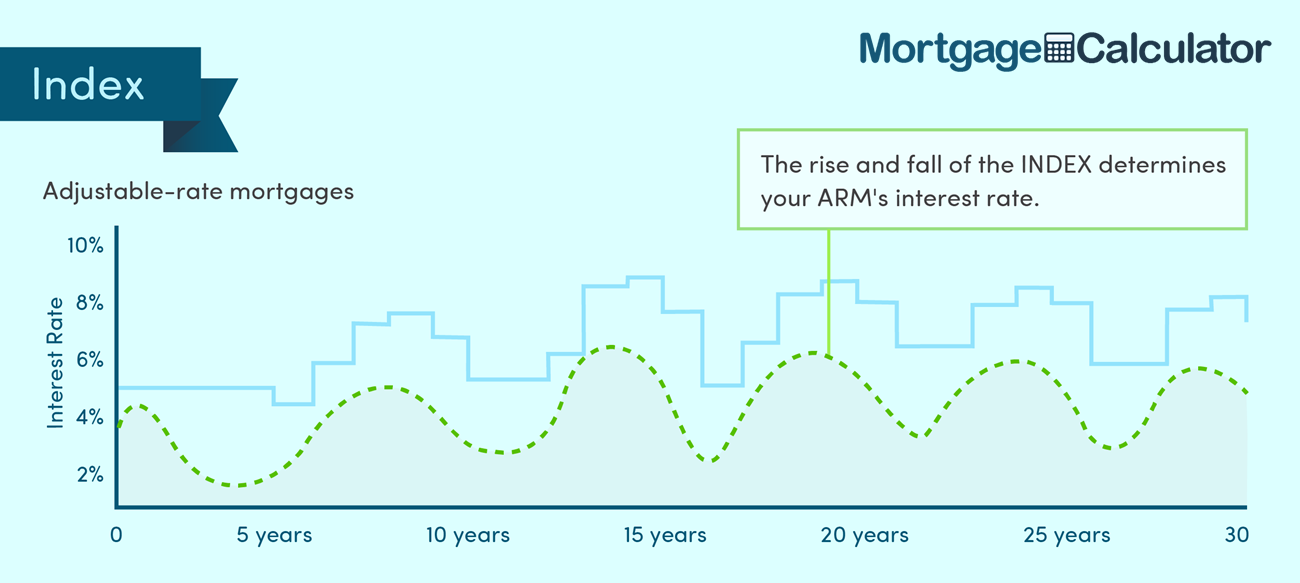
The index, often referred to as a reference rate, is a rate specified in the contract which the ARM rate will follow. Different lenders choose different indexes, but some of the most popular indexes are:
Some lenders may choose to use a proprietary internal cost of funds index rather than a widely used external rate.
This percent is added to the index rate to determine the interest rate charged on the ARM loan.
If a loan is indexed against COFI with a margin of 3% then if COFI goes from 1.9% to 2.7% the ARM's interest rate would shift from 4.9% to 5.7% APR.
Adding the margin to the index gives one what is called the fully indexed rate.
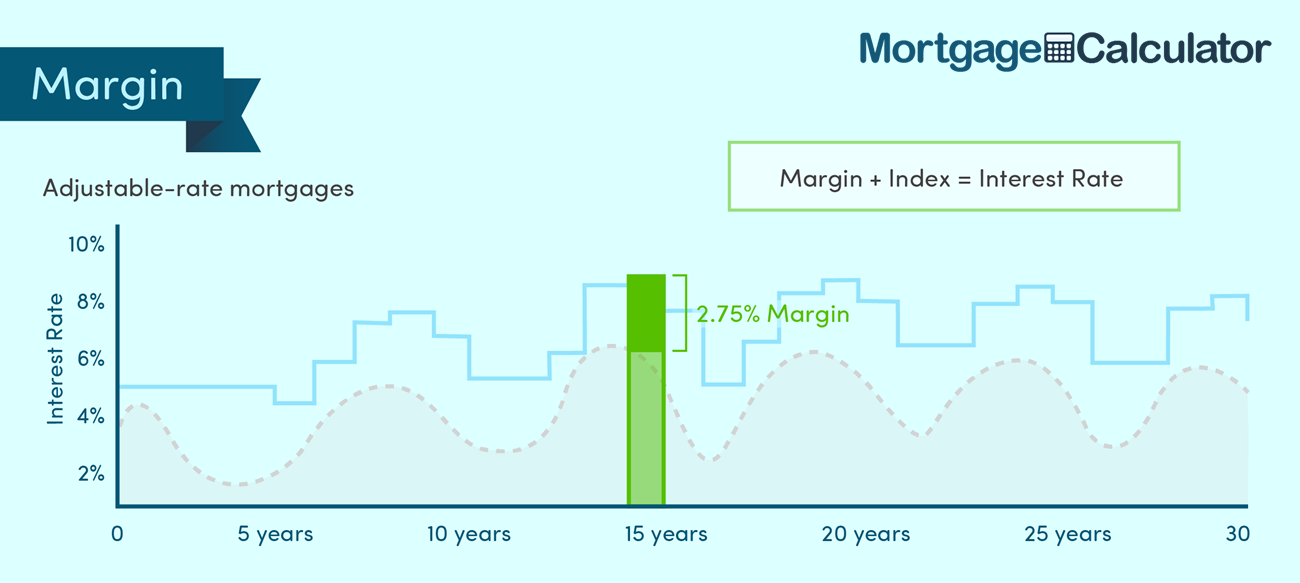
Some lenders may vary the amount of margin applied to the loan based on your credit score. Be sure to ask what happens to your margin if your credit score improves or falls significantly.
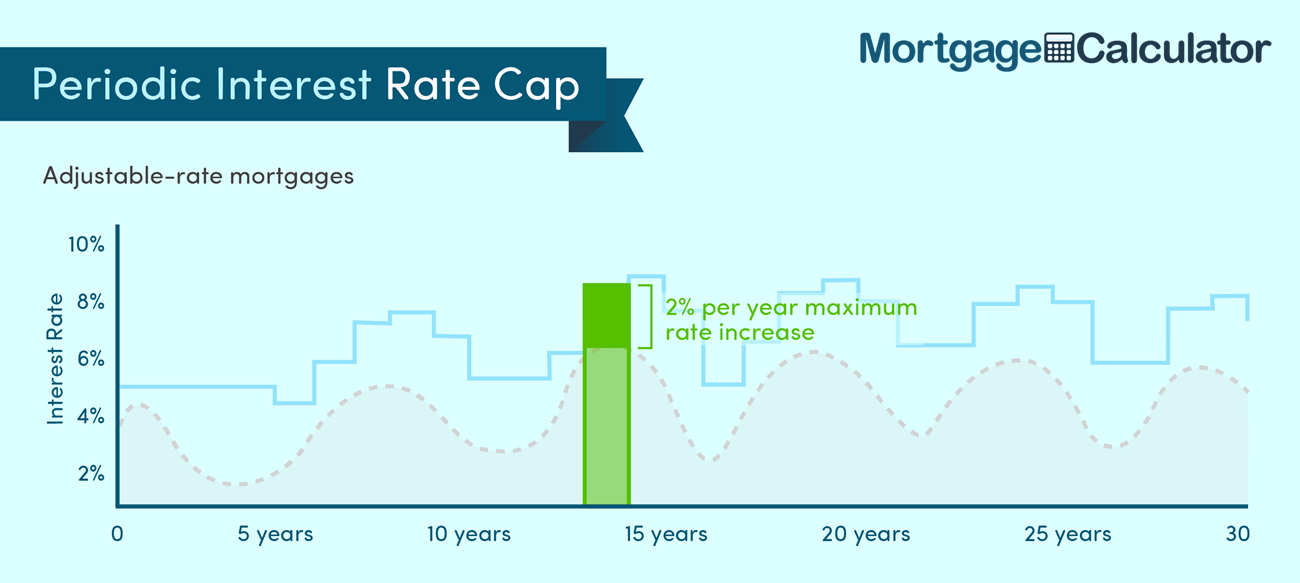
Loans have limits on how much rates can adjust periodically. Some loans have the same limit for the first adjustment as all subsequent adjustments, while other loans have a separate limit on the first adjustment versus subsequent adjustments.
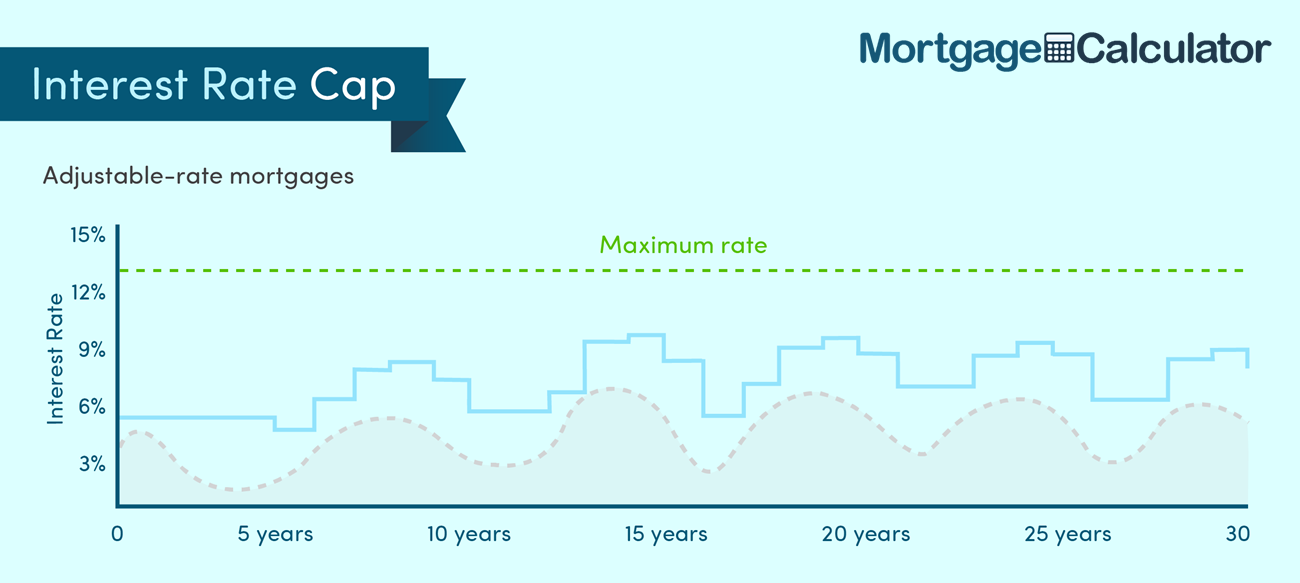
Loan contracts also stipulate a lifetime rate limit which the loan may not exceed.
A cap of 2/2/5 means the loan can change up to 2% on any adjustment up to a lifetime adjustment of 5% above the initial rate of interest.
A loan with a 2/1/5 cap can change 2% on the first adjustment, up to 1% on any subsequent adjustments, up to a lifetime adjustment of 5% above the initial rate of interest.
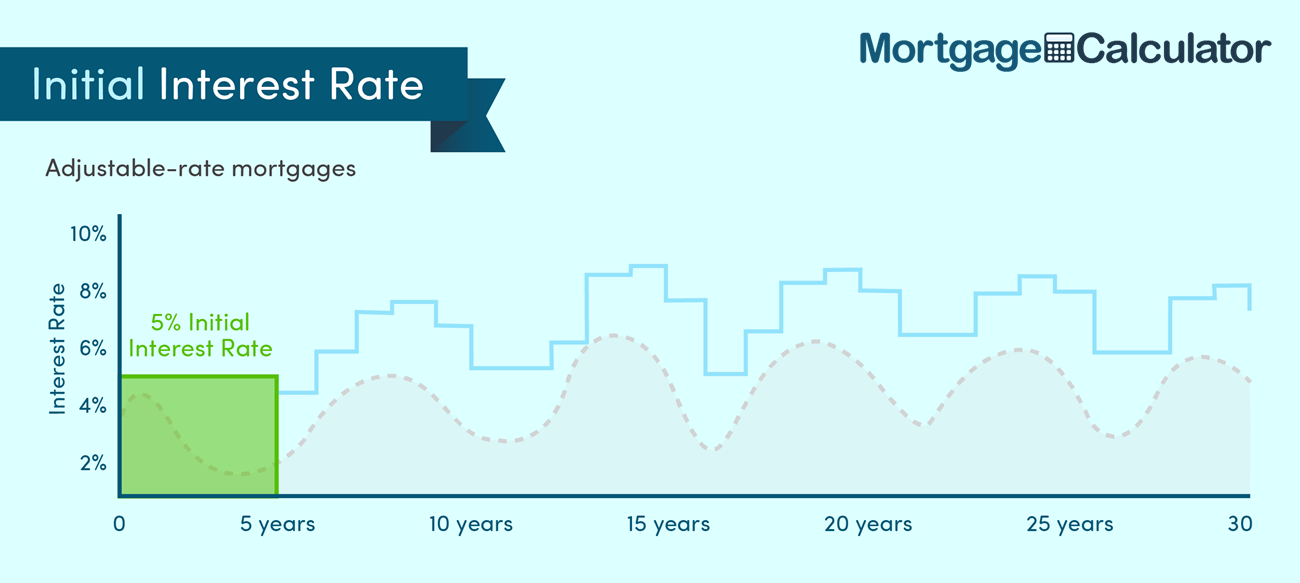
After the initial introductory period, rates usually reset each year on the anniversary of the mortgage. The exact date used to cite the new reference rate depends on the index used, but it is typically done about 45 days ahead of the anniversary of the loan.
Buying points allow a home buyer to pay for a lower rate of interest. Typically 1 point is equivalent to 1% of the loan's principal. For a $240,000 loan 1 point would be $2,400. Points can be paid upfront by the home buyer and/or seller. They can also be rolled into the loan's principal.
On a fixed-rate mortgage the upfront points payment guarantees the lower rate of interest for the life of the loan. On an ARM loan any points payments may only hold the rate down during the introductory rate period, with rates rising significantly thereafter. Points are thus generally less valuable on ARMs than they are on FRMs.
What's more, even if the referenced index rate does not rise, an ARM adjustment may drive your initial discounted rates up when the loan shifts from the initial rate to the fully indexed rate.
Pre-payment penalties may make it hard to either sell your home or refinance into a fixed rate.
Most prime mortgages allow prepayment without penalty, but some subprime ARM loans may charge a fee or penalty for pre-payment. These penaties are more common during the initial teaser rate period, though in some cases the penalty period may last a few years longer than the teaser rate. Some pre-payment penalties may kick in when a loan is completely paid off, while other loans can be structured to charge a penalty even if the loan is only partially paid off ahead of schedule.
Be sure to ask if your loan contains a pre-payment penalty, how much it may cost, how long it lasts & what would trigger it.
Some loans have a built-in conversion clause which allows the lender to convert the loan to a fully amortizing fixed-rate mortgage during certain time periods, like at the end of the first adjsutment period or when a loan is negative amoritizing and reaches 110% or 125% of the original loan amount.
Your loan document should state when the loan is convertable, if there are any fees associated with the conversion & what would set the rate of interest during a conversion.
When obtaining an ARM make sure to ask what the Annual Percentage Rate (APR) is on the loan. If the initial rate is lower than that rate one might expect payments to increase significantly even if the reference rate the loan is indexed against does not change.
Currently the spread between FRMs & ARMs is quite low, which makes fixed-rates a relatively better deal. As interest rates rise, typically the spread between fixed & adjustable loans increases significantly, which can make ARM loans a more attractive option.
Here are historical average annual interest rates for popular home loan products.
| Year | 30-YR FRM Rate | 30-YR Points | 15-YR FRM Rate | 15-YR Points | 1-YR ARM Rate | 1-YR Points | 1-YR Margin | 5/1-YR ARM Rate | 5/1-YR Points | 5/1-YR Margin |
|---|---|---|---|---|---|---|---|---|---|---|
| 2019 | 3.94 | 0.5 | 3.39 | 0.5 | 3.14 | 0.3 | 2.75 | |||
| 2018 | 4.54 | 0.5 | 4.00 | 0.5 | 3.82 | 0.3 | 2.76 | |||
| 2017 | 3.99 | 0.5 | 3.27 | 0.5 | 3.20 | 0.4 | 2.74 | |||
| 2016 | 3.65 | 0.5 | 2.93 | 0.5 | 2.87 | 0.5 | 2.74 | |||
| 2015 | 3.85 | 0.6 | 3.09 | 0.6 | 2.53 | 0.3 | 2.74 | 2.94 | 0.5 | 2.74 |
| 2014 | 4.17 | 0.6 | 3.29 | 0.6 | 2.44 | 0.4 | 2.73 | 3.02 | 0.5 | 2.74 |
| 2013 | 3.98 | 0.7 | 3.11 | 0.7 | 2.62 | 0.4 | 2.76 | 2.88 | 0.5 | 2.75 |
| 2012 | 3.66 | 0.7 | 2.93 | 0.7 | 2.69 | 0.5 | 2.76 | 2.78 | 0.6 | 2.74 |
| 2011 | 4.45 | 0.7 | 3.68 | 0.7 | 3.03 | 0.6 | 2.76 | 3.31 | 0.6 | 2.74 |
| 2010 | 4.69 | 0.7 | 4.1 | 0.7 | 3.78 | 0.6 | 2.76 | 3.82 | 0.6 | 2.74 |
| 2009 | 5.04 | 0.7 | 4.57 | 0.7 | 4.7 | 0.6 | 2.75 | 4.75 | 0.6 | 2.74 |
| 2008 | 6.03 | 0.6 | 5.62 | 0.6 | 5.17 | 0.6 | 2.74 | 5.74 | 0.6 | 2.75 |
| 2007 | 6.34 | 0.4 | 6.03 | 0.4 | 5.56 | 0.6 | 2.75 | 6.07 | 0.5 | 2.76 |
| 2006 | 6.41 | 0.5 | 6.07 | 0.5 | 5.54 | 0.7 | 2.76 | 6.08 | 0.6 | 2.77 |
| 2005 | 5.87 | 0.6 | 5.42 | 0.6 | 4.49 | 0.7 | 2.77 | 5.32 | 0.6 | 2.78 |
| 2004 | 5.84 | 0.7 | 5.21 | 0.6 | 3.9 | 0.7 | 2.77 | |||
| 2003 | 5.83 | 0.6 | 5.17 | 0.6 | 3.76 | 0.6 | 2.76 | |||
| 2002 | 6.54 | 0.6 | 5.98 | 0.6 | 4.62 | 0.7 | 2.77 | |||
| 2001 | 6.97 | 0.9 | 6.5 | 0.9 | 5.82 | 0.9 | 2.77 | |||
| 2000 | 8.05 | 1 | 7.72 | 1 | 7.04 | 1 | 2.78 | |||
| 1999 | 7.44 | 1 | 7.06 | 1 | 5.99 | 1.1 | 2.79 | |||
| 1998 | 6.94 | 1.1 | 6.59 | 1.1 | 5.58 | 1.1 | 2.79 | |||
| 1997 | 7.6 | 1.7 | 7.13 | 1.7 | 5.61 | 1.4 | 2.79 | |||
| 1996 | 7.81 | 1.7 | 7.32 | 1.7 | 5.67 | 1.4 | 2.79 | |||
| 1995 | 7.93 | 1.8 | 7.48 | 1.8 | 6.06 | 1.5 | 2.8 | |||
| 1994 | 8.38 | 1.8 | 7.86 | 1.8 | 5.36 | 1.5 | 2.79 | |||
| 1993 | 7.31 | 1.6 | 6.83 | 1.6 | 4.58 | 1.5 | 2.77 | |||
| 1992 | 8.39 | 1.7 | 7.96 | 1.7 | 5.62 | 1.7 | 2.76 | |||
| 1991 | 9.25 | 2 | 7.09 | 1.9 | 2.77 | |||||
| 1990 | 10.13 | 2.1 | 8.36 | 2.1 | 2.77 | |||||
| 1989 | 10.32 | 2.1 | 8.8 | 2.3 | 2.77 | |||||
| 1988 | 10.34 | 2.1 | 7.9 | 2.3 | 2.75 | |||||
| 1987 | 10.21 | 2.2 | 7.83 | 2.2 | ||||||
| 1986 | 10.19 | 2.2 | 8.43 | 2.3 | ||||||
| 1985 | 12.43 | 2.5 | 10.05 | 2.5 | ||||||
| 1984 | 13.88 | 2.5 | 11.51 | 2.5 | ||||||
| 1983 | 13.24 | 2.1 | ||||||||
| 1982 | 16.04 | 2.2 | ||||||||
| 1981 | 16.63 | 2.1 | ||||||||
| 1980 | 13.74 | 1.8 | ||||||||
| 1979 | 11.2 | 1.6 | ||||||||
| 1978 | 9.64 | 1.3 | ||||||||
| 1977 | 8.85 | 1.1 | ||||||||
| 1976 | 8.87 | 1.1 | ||||||||
| 1975 | 9.05 | 1.1 | ||||||||
| 1974 | 9.19 | 1.2 | ||||||||
| 1973 | 8.04 | 1 | ||||||||
| 1972 | 7.38 | 0.9 |
Source: Freddie Mac PMMS
Most adjustable-rate mortgages have an introductory period where the rate of interest and monthly payments are fixed. After the initial introductory period the loan shifts from acting like a fixed-rate mortgage to behaving like an adjustable-rate mortgage, where rates are allowed to float or reset each year. If a loan is named a 5/1 ARM then what that means is the loan is fixed for the first 5 years & then the rate resets each year thereafter. The initial loan interest rate is frequently discounted below the "fully indexed" rate one would get by adding the margin to the indexed reference rate.
These other loan formats were more popular during the housing bubble, but have become much less common since the bubble burst.
Lenders want to know you will be able to repay your loan before they make it. If a lender offers a "low doc" or "no doc" loan option that option will typically charge a higher rate of interest to make up for the added risk in lending you money.
These interest-only home loans act similar to other ARMs with the exception that the intitial fixed period of the loan only covers the accrued interest on the loan while leaving the principal unchanged. Once the teaser rate expires the loan automatically shifts into a regular amortizing ARM loan. For example, a 5/1 IO ARM would charge interest-only for the first 5 years of the loan, then at that point the loan would convert into an amortizing loan where the remaining principal is paid off over the subsequent 25 remaining years of the loan. It is effectively like 2 loans in one
The same could be said for a 3 year IO or a 10 year IO loan. They would charge a fixed rate of interest for 3 & 10 years respectively, and then the loans would amortize at a floating interest rate for the remaining 27 & 20 years respectively.
Loans with a longer initial IO period have higher subsequent payments thereafter because they are forced to pay off interest AND the entire loan balance in a fewer number of subsequent years.
IO loans typically charge a fixed rate of interest during the introductory IO period, but some loans can also charge variable rates during the interest-only portion of the loan.
These loans are typically 30-year ARMs which enable the borrower to "pick-a-payment" between four amounts: a fully amortizing 30-year payment, a fully amortizing 15-year payment, an interest-only payment, and a specified minimum payment.
When borrowers consistently make pay-option payments below the accured interest the loan becomes negative amortizing, with the loan balance growing over time. Most option ARM contracts which allow for negative amortization have a maximium negative amortization limit (at 110% to 125% of the initial loan amount). When this neg am limit is reached the loan is recast & minimum payments are automatically shifted to the fully amortizing payment.
Payment caps are similar to rate caps, but they apply to how much your monthly payment can change each year rather than the rate of interest. If an Option-ARM has a payment cap of 6% and your monthly loan payment was $1,000 per month then the payment amount won't go above $1,060 the following year. Any unpaid interest on such an Option-ARM loan would then get added to the loan's balance, leading to negative amortization.
Option ARMs typically recast automatically every 5 years to adjust the ARM to payment amounts that will ensure the loan is paid off over the initial 30-year loan term.
If you only make the minimum payments near the end of a Payment-option ARM then you may also owe a balloon payment to pay off the remaining principal at the end of the loan.
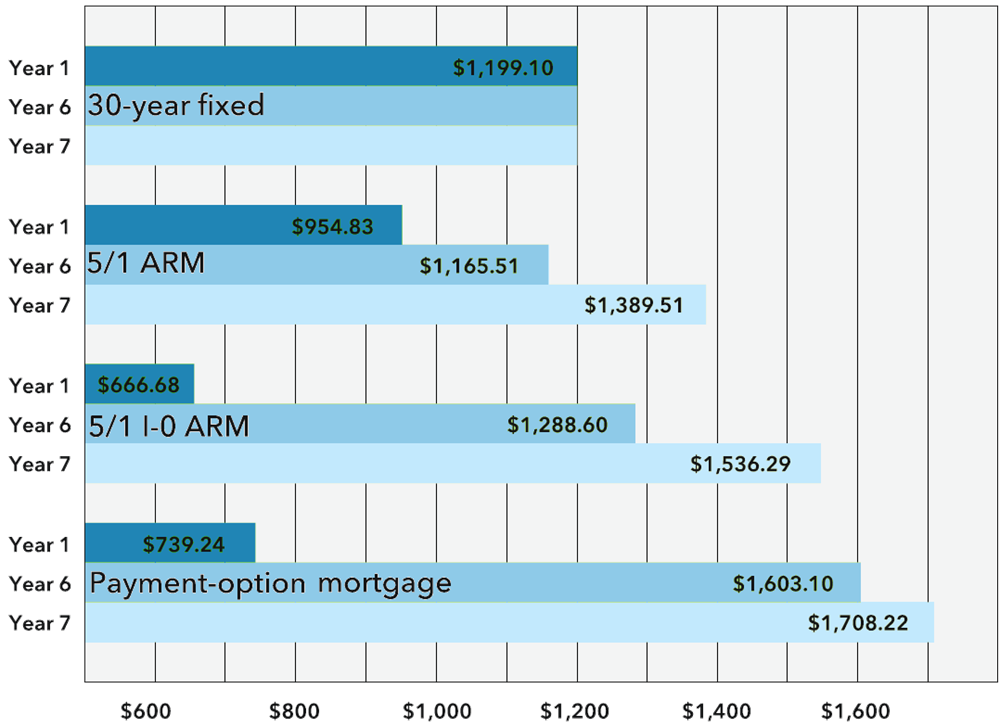
Here is a table courtesy the CFPB wich shows how loan payments can change over time for various types of ARM loans.
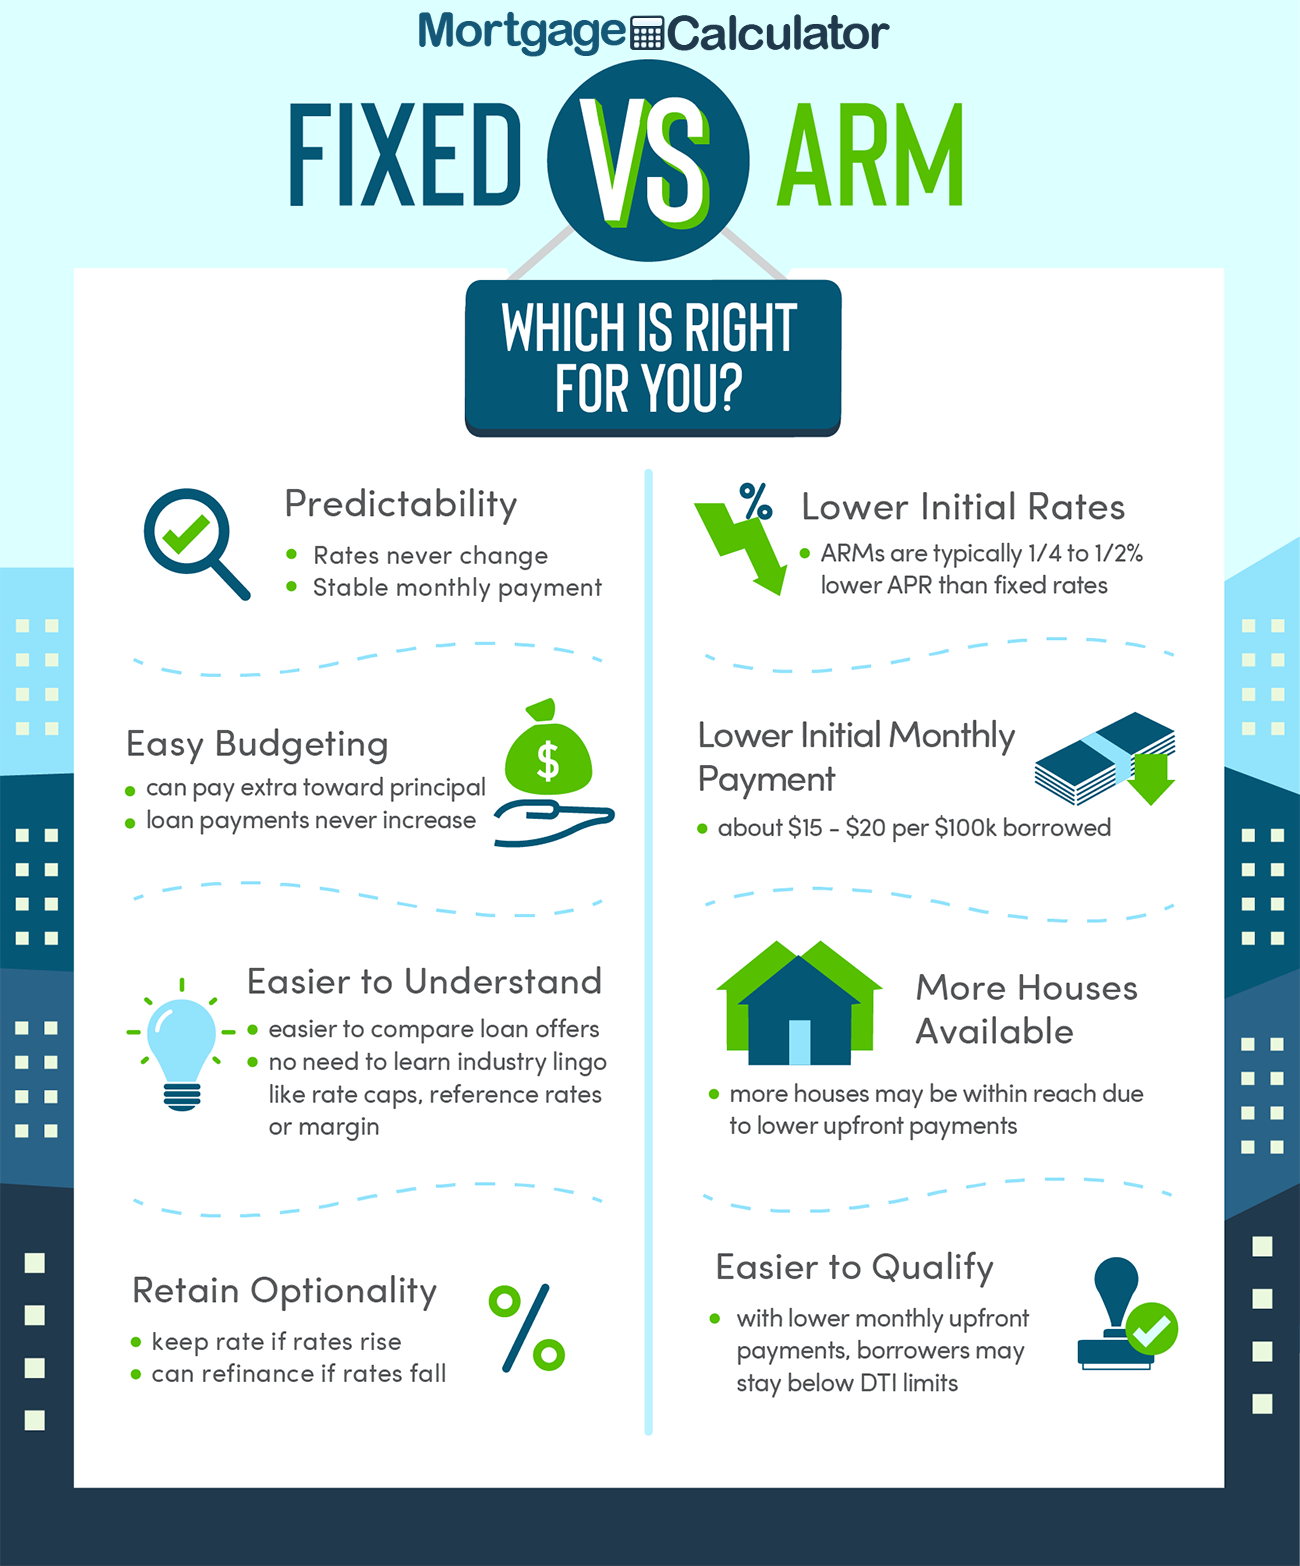
Fixed-rate loans guarantee a homeowner a set rate of interest and a fixed monthly payment amount throughout the duration of the loan.
Banks use short-term deposits to fund longer duration lending. When banks fund 30-year loans it creates a duration mismatch which they must compensate for by charging a higher rate of interest.
ARMs can charge lower rates of interest than fixed-rate loans because they help banks manage the asset-liability missmatch by transfering some of the interest rate shift risk onto the home buyer.
Some fixed-rate loans start with an introductory rate for the first year or two & then step to another interest rate for the duration of the loan. While these loans are not technically ARMs (since there is only 1 rate shift throughout the duration of the loan) that rate shift will still cause a monthly payment shift similar to what is seen with ARMs.
ARM loans enable lower initial monthly home payments, which can help young people with significant sutdent loan debt qualify for a loan that might be just out of reach with a fixed-rate mortgage. If those home buyers aggressively pay down other higher-interest debts early in their loan & obtain regular raises then their disposible income may rise faster than their monthly mortgage payments. If the home appreciates or rates fall further while the borrower's credit profile improves they can then refinance their ARM into a FRM.
Historically homeowners in the United States have moved about once every 5 to 7 years. After the Great Recession the economy became less dynamic. According to the National Association of Realtors Profile of Home Buyers and Sellers for 2017, the average tenure has risen to 10 years.
If a borrower does not intend to live in the home longterm, then it can make sense to leverage a lower rate adjustable loan & then move before rates reset.
Some ARM loans do not adjust rates downward if interest rates fall. Be sure to ask if there is a floor rate on your loan. If there is a floor rate, you may need to refinance to take advantage of falling rates.
Many people in the real estate trade including house flippers leverage ARM loans to increase their profit margins.
Locking in a fixed-rate is a one-way bet for homeowners. If rates fall they are able to refinance into a lower rate loan, but if rates rise they get to keep their current rates.
In such a way financial institutions that make fixed-rate loans can lose 2 ways:
The following table compares a $240,000 loan across common FRM & ARM terms.
| Loan | 3/1 IO ARM | 3/1 ARM | 5/1 ARM | 7/1 ARM | 30 Year Fixed | 15 Year Fixed |
|---|---|---|---|---|---|---|
| Initial Payment | $662 | $1,019.63 | $1,060.37 | $1,089.80 | $1,119.66 | $1,670.12 |
| Avg Payment | $1,689.17 | $1,586.77 | $1,556.34 | $1,515.66 | $1,119.66 | $1,670.12 |
| Max Payment | $1,836.07 | $1,680.09 | $1,686.34 | $1,676.45 | $1,119.66 | $1,670.12 |
| Initial APR | 3.31% | 3.06% | 3.37% | 3.59% | 3.81% | 3.11% |
| Max APR | 8.31% | 3.06% | 8.37% | 8.59% | 3.81% | 3.11% |
| Total Interest | $368,101.73 | $331,237.33 | $320,281.21 | $305,637.08 | $163,079 | $60,622 |
The above table presumes a 5% lifetime rate cap over the duration of all ARM loans. It also presumes a 2% initial rate adjustment followed by subsequent 1% rate adjustments up until the lifetime loan cap is reached. These payments are for principal & interest, but do not include other costs of homeownership like insurance and property taxes.
The following table shows what the annual payments would be on a 3/1 ARM, presuming the same above conditions.
| Year | 3/1 ARM Max Payment | 3/1 Max APR | 3/1 Ending Balance | 30 YR FRM Payment | 30 YR APR | 30 YR Balance |
|---|---|---|---|---|---|---|
| 1 | $1,019.63 | 3.06% | $235,039.23 | $1,119.66 | 3.81% | $235,632.33 |
| 2 | $1,019.63 | 3.06% | $229,924.51 | $1,119.66 | 3.81% | $231,095.32 |
| 3 | $1,019.63 | 3.06% | $224,651.05 | $1,119.66 | 3.81% | $226,382.40 |
| 4 | $1,272.90 | 5.06% | $220,651.74 | $1,119.66 | 3.81% | $221,486.74 |
| 5 | $1,406.41 | 6.06% | $217,047.30 | $1,119.66 | 3.81% | $216,401.27 |
| 6 | $1,542.36 | 7.06% | $213,757.38 | $1,119.66 | 3.81% | $211,118.60 |
| 7 | $1,680.11 | 8.06% (lifetime cap) | $210,714.15 | $1,119.66 | 3.81% | $205,631.13 |
| 8 | $1,680.11 | 8.06% (lifetime cap) | $207,416.37 | $1,119.66 | 3.81% | $199,930.92 |
Before ARM loans existed market participants had other creative financial means to smooth out real estate demand including home builder buydowns & the use of contracts for deeds.
ARM loans were legalized nationally for federally chartered savings and loan institutions in 1981. By 1982 ARMs were widely issued with an estimated stock of $65 billion in loans by the end of the year. In 1983 $39 billion in additional stock was added. By 1984 ARMs accounted for about 60% of new conventional mortgages closed that year (exclusive of FHA & VA loans). Loan volumes grew so quickly that Freddie Mac tightened lending criteria in 1984 & Fannie Mae tightened their standards in 1985.
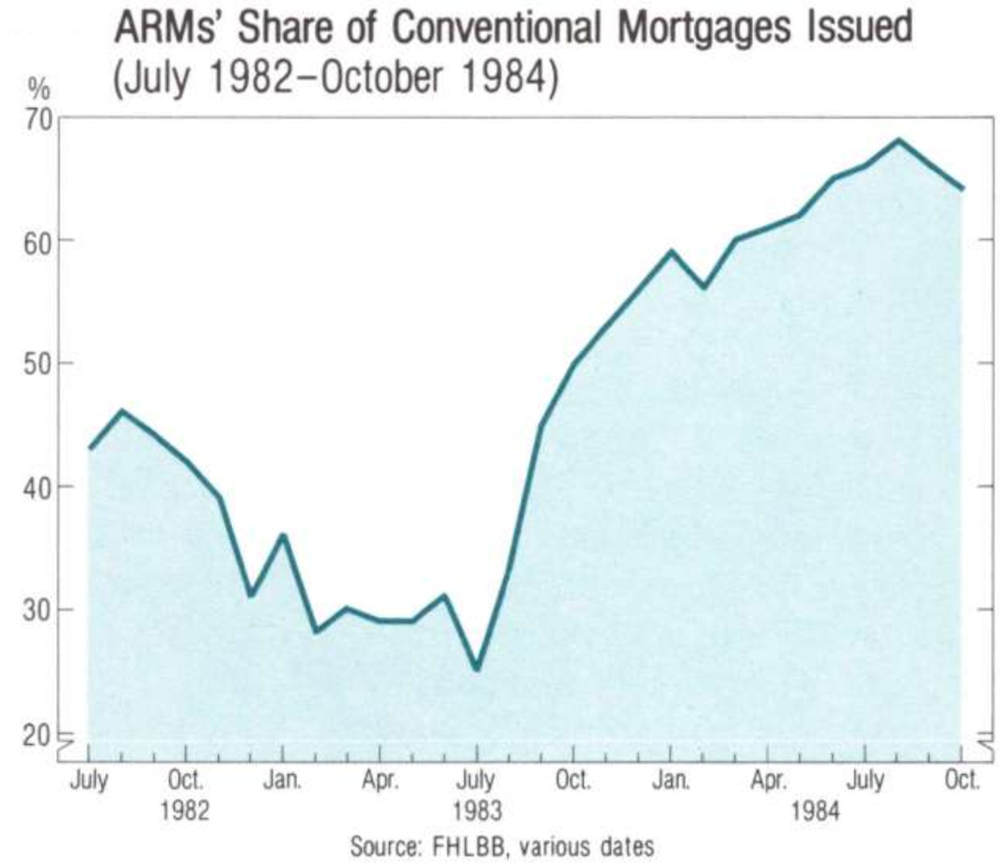
A similar spike in demand for ARMs happened in the early to mid 1990s & once again during the waning days of the early 2000s housing bubble.
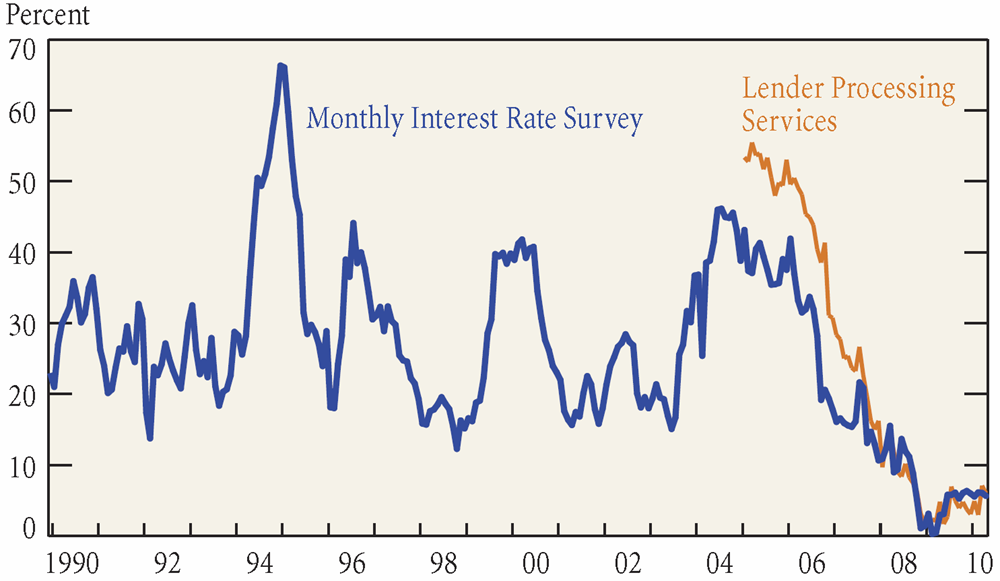
When consumers buy an adjustable rate loan the bank is passing much of the rate risk onto the home buyer, whereas if the consumer chooses a fixed-rate loan the bank has to price the risk of interest rate moves into the loan. If rates increase and a homeowner financed using a fixed rate they are not impacted by shifting market rates. If rates fall during the loan the homeowner may be able to refinance.
If rates are quite low the gap between ARM and FRM loans can be insufficent to make ARMs seem like a compelling deal. The decline in mortgage rates after the recession has drastically reduced consumer demand for adjustable-rate mortgages.
A number of factors drove down interest rates. Some of them include: the recession, slow economic growth after the recession, the Federal Reserve's quantitative easing programs, operation twist, the Federal Reserve buying $1.25 trillion in agency Mortgage-Backed Securities (MBS), under-funded pension plans needing to get more yield than they could from treasuries & some other central banks pushing their domestic interest rates to zero and even into negative numbers.
| Loan Type | Loans | Sample Share |
|---|---|---|
| 30-year FRM | 107,991 | 61.49% |
| 15-year FRM | 25,717 | 14.64% |
| FRM With Other Terms | 17,221 | 9.81% |
| Non-FRM (ARMs + Atypical Loans) | 24,685 | 14.06% |
Source: U.S. Bureau of Labor Statistics, 2004-2014 Consumer Expenditure Survey pooled sample.
| Year | Loans in Sample | 30-yr Fixed | 15-yr Fixed | Other Fixed | Non-fixed |
|---|---|---|---|---|---|
| 2014 | 12,912 | 70.8% | 13.4% | 8.5% | 7.3% |
| 2013 | 13,806 | 70.7% | 13.3% | 8.8% | 7.2% |
| 2012 | 14,649 | 70.7% | 13.6% | 8.9% | 6.8% |
| 2011 | 15,133 | 71.7% | 12.8% | 9.1% | 6.4% |
| 2010 | 16,265 | 68.0% | 14.2% | 9.3% | 8.5% |
| 2009 | 17,155 | 65.6% | 15.1% | 9.8% | 8.5% |
| 2008 | 17,314 | 65.5% | 15.0% | 10.6% | 9.0% |
| 2007 | 17,257 | 56.4% | 15.0% | 11.4% | 17.4% |
| 2006 | 18,407 | 48.3% | 14.0% | 10.3% | 27.4% |
| 2005 | 17,666 | 47.0% | 16.6% | 10.0% | 26.4% |
| 2004 | 15,050 | 47.4% | 17.9% | 10.4% | 24.3% |
If anything the above tables understate the current dominance of the 30 year FRM.
If one looks at the market as a whole, the popularity of using 15-year FRM to refinance makes the overall market composition look a bit more even than it would without refis.
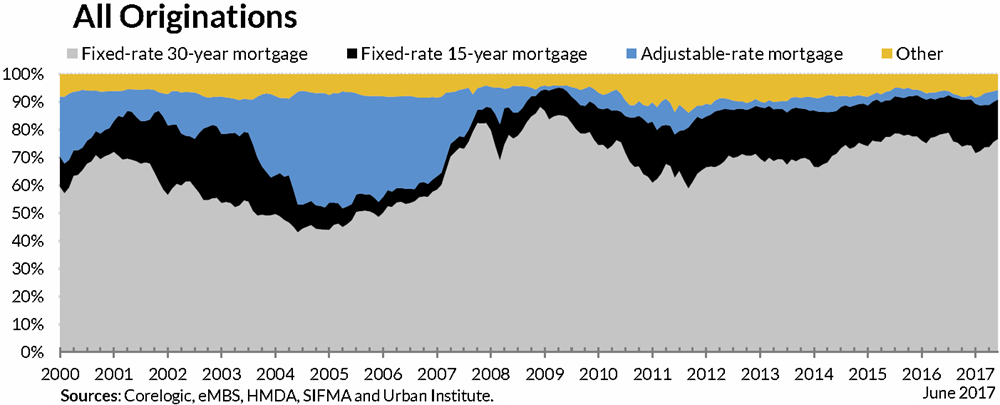
If one looks exclusively at purchases FRMs are about 90% of the market.
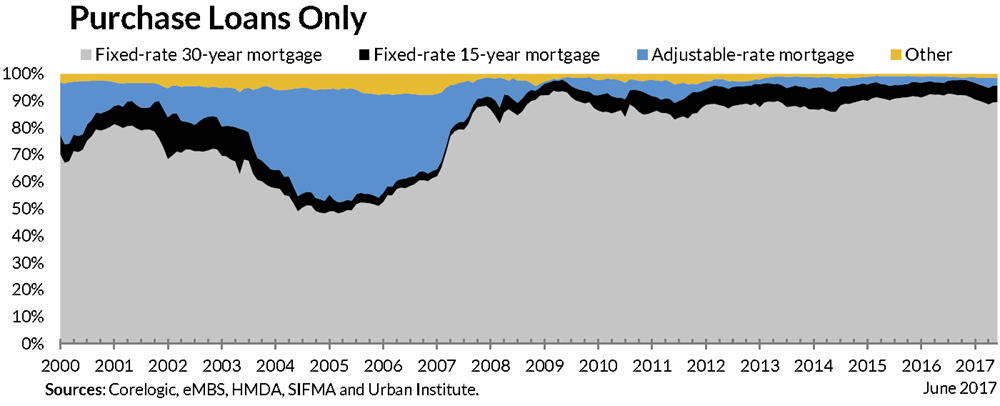
Source: Urban Institute
A disproportionate share of jumbo mortgages were structured as ARMs. After the recession hit, many exotic sources of financing which previously funded jumbo loans dried up.
The FHFA increased conforming loan limits by 7.8% to $359,650 in 2005 and 15.9% to $417,000 in 2006. The Economic Stimulus Act of 2008 further increased conforming loan limits in high cost areas to 125% of the median price for residents of the applicable size. In 2009 the American Recovery and Reinvestment Act offered first-time homebuyers an $8,000 refundable credit for homes bought between January 1, 2009, and December 1, 2009. As housing prices fell nationwide, conventional mortgage caps were lifted and tax incentives helped more people qualify for & afford conventional conforming mortgages.
As jumbo loans decreased in marketshare, an increasing share of the overall mortgage market was available for securitization in standard mortgage-backed securities.
Mortgage underwriting was exceptionally lax during the housing bubble. There was accounting-control fraud reaching all aspects of the industry from appraisals on through to underwriting & securitization.
"Slackened underwriting standards—manifested most dramatically by lenders allowing borrowers to forego down payments entirely—combined with stagnant to falling house prices in many parts of the country appear to be the most immediate contributors to the rise in mortgage defaults. The surge in early payment defaults and the rise in the share of mortgages with low or no documentation suggest that underwriting also deteriorated along other dimensions. Because down payments were so small, when house prices declined, many borrowers had little or no equity in their properties and thus less incentive to repay their mortgages. In the industrial Midwest, economic distress was also a factor in the heightened defaults. Unorthodox mortgage features such as rate resets, prepayment penalties, or negative amortization provisions do not appear to be significant contributors to date to the defaults because borrowers who experienced problems with these provisions could refinance into other mortgages. However, as markets realized the extent of the poor underwriting and house prices began to fall, refinancing opportunities became more limited. Borrowers may not be able to resolve their problems with these products through refinancing going forward and thus may be forced to default." - The Rise in Mortgage Defaults by Christopher J. Mayer, Karen M. Pence, and Shane M. Sherlund
When private sources of credit dried up after the crash, some of the boiler room styled "stated-income" and "NINJA" loans disappeared from the marketplace. With that, consumers who had little chance of ever paying their loans were removed from the mortgage market.
The belief in homeownership as a cornerstone of the American dream was widespread before the housing crisis, but those who over-extended themselves and got caught up in the bubble were in no rush to get back into the market after going through foreclosure.
Movies like The Big Short & Inside Job accurately portrayed behind-the-scenes actions of financial industry insider, but negative publicity surrounding the housing crisis has many people believing the cause of the crisis was ARM loans to subprime borrowers rather than widespread predatory lending & accounting-control fraud.
Certainly the belief that home prices could not go down was widespread after median home prices went up every year between 1991 and 2007, but however greedy borrowers may have been in buying 2 or 3 homes, it is the job of the banks to ensure the borrowers are qualified. It is - after all - the job of banks to judiciously allocate scarce capital resources effectively across the economy. Private lenders were responsible for over 84% of subprime loans in 2006.
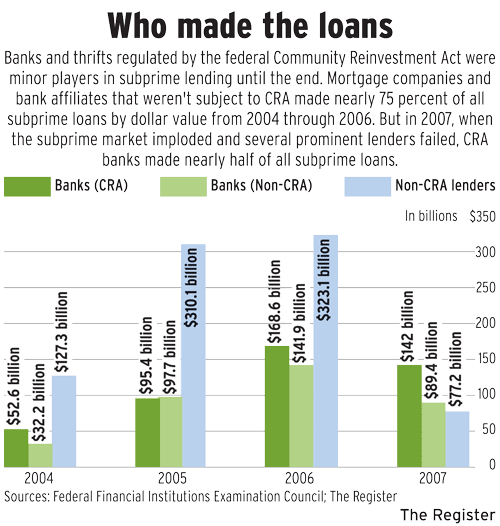
As private credit dried up an increasing share of home buyers shifted away from conventional mortgages backed by Fannie Mae & Freddie Mac to using FHA loans.
The low downpayment requirement coupled with allowing looser credit standards than typical conforming mortgages makes FHA loans a widely popular option. In 2016 FHA loans represented 19.9% of home purchases, 10.9% of refinances & 15.8% of the total mortgage market. The following table shows how popular FHA loans have been over time.
| Year | FHA Buy | FHA Refi | FHA Total | FHA Purchase * | Total Purchase # | FHA Refi * | Total Refi # | FHA Total * | Market Total # |
|---|---|---|---|---|---|---|---|---|---|
| 1996 | 15.4% | 5.8% | 12.3% | 696,504 | 4,524,674 | 123,475 | 2,146,882 | 819,979 | 6,671,555 |
| 1997 | 16.4% | 6.8% | 13.9% | 758,967 | 4,624,352 | 109,546 | 1,608,195 | 868,513 | 6,232,547 |
| 1998 | 13.9% | 6.8% | 10.5% | 787,703 | 5,656,199 | 348,044 | 5,138,962 | 1,135,747 | 10,795,161 |
| 1999 | 14.7% | 4.1% | 9.5% | 913,216 | 6,226,372 | 244,578 | 5,955,905 | 1,157,794 | 12,182,277 |
| 2000 | 13.9% | 3.9% | 11.7% | 844,835 | 6,074,004 | 65,987 | 1,692,510 | 910,822 | 7,766,513 |
| 2001 | 14.3% | 7.4% | 11.0% | 869,524 | 6,100,159 | 407,424 | 5,526,541 | 1,276,948 | 11,626,700 |
| 2002 | 11.5% | 4.0% | 7.0% | 764,453 | 6,624,756 | 411,781 | 10,296,778 | 1,176,234 | 16,921,535 |
| 2003 | 9.1% | 3.6% | 5.2% | 630,119 | 6,954,384 | 652,853 | 17,932,247 | 1,282,972 | 24,886,631 |
| 2004 | 6.9% | 3.3% | 5.0% | 467,293 | 6,791,344 | 248,428 | 7,527,744 | 715,721 | 14,319,088 |
| 2005 | 4.5% | 1.8% | 3.1% | 322,915 | 7,233,456 | 133,261 | 7,251,637 | 456,176 | 14,485,093 |
| 2006 | 4.5% | 2.0% | 3.3% | 295,261 | 6,563,679 | 115,859 | 5,765,899 | 411,120 | 12,329,578 |
| 2007 | 6.1% | 4.2% | 5.1% | 317,181 | 5,222,266 | 211,093 | 5,071,725 | 528,274 | 10,293,991 |
| 2008 | 24.1% | 15.6% | 19.8% | 844,893 | 3,508,103 | 560,767 | 3,583,680 | 1,405,660 | 7,091,783 |
| 2009 | 32.6% | 14.8% | 21.1% | 1,088,356 | 3,338,302 | 896,558 | 6,052,223 | 1,984,914 | 9,390,525 |
| 2010 | 32.3% | 9.5% | 17.5% | 944,159 | 2,925,707 | 518,571 | 5,432,837 | 1,462,730 | 8,358,544 |
| 2011 | 26.8% | 6.6% | 14.1% | 760,352 | 2,837,237 | 321,847 | 4,848,733 | 1,082,199 | 7,685,970 |
| 2012 | 23.6% | 7.4% | 12.3% | 738,227 | 3,129,414 | 526,635 | 7,124,752 | 1,264,862 | 10,254,166 |
| 2013 | 18.0% | 9.7% | 13.2% | 664,944 | 3,694,162 | 507,010 | 5,217,051 | 1,171,954 | 8,911,213 |
| 2014 | 16.0% | 7.1% | 12.9% | 601,335 | 3,751,328 | 181,871 | 2,551,037 | 783,206 | 6,302,365 |
| 2015 | 19.6% | 11.5% | 15.9% | 811,092 | 4,131,364 | 409,517 | 3,555,550 | 1,220,609 | 7,686,914 |
| 2016 | 19.9% | 10.9% | 15.8% | 890,565 | 4,476,326 | 412,779 | 3,794,919 | 1,303,344 | 8,271,245 |
Predatory lending happens when lenders make loans they know can not be paid off by the borrower. Even some of the largest lenders broadly engaged in this type of behavior during the housing bubble leading up to the Great Recession.
A big part of the reason demand for ARMs was so high during the housing bubble & prior to the housing crash was due to systemic fraud. It is easier to push a person who has no chance of paying the loan into a loan which has a lower upfront payment. That way the person can make payments until the loan is securitized and sold off. Just prior to the crash 80% of Citibank's home loans were misrepresented.
"I started issuing warnings in June of 2006 and attempted to get management to address these critical risk issues. These warnings continued through 2007 and went to all levels of the Consumer Lending Group. We continued to purchase and sell to investors even larger volumes of mortgages through 2007. And defective mortgages increased during 2007 to over 80% of production." - Richard M. Bowen, III, Citigroup Business Chief Underwriter for Correspondent Lending in the Consumer Lending Group
This type of lending has become rare after increased banking regulations which came about due to the financial crisis. These regulations might get wound back though. In 2017 the Senate voted to make it harder for consumers to sue banks.
The above is not to say that ARM mortgages are exceptionally risky, but rather that financeers had greater incentive to push marginal borrowers into ARMs because the initial qualification was easier & it was easier to make the initial teaser rate payments.
Correlation is not causation.
Those who have a solid financial footing and are aware of the potential costs of a rising interest rate environment are not necessarily being exposed to extreme levels of risk.
It is important to see how your loan payments are likely to change over the life of the loan. Buying points allow a home buyer to pay for a lower rate of interest, but it still does not lower how much debt they must repay. On a fixed-rate mortgage the upfront points payment guarantees the lower rate of interest for the life of the loan. On an ARM loan any points payments may only hold the rate down during the initial introductory rate period, with rates rising significantly thereafter. Points are thus far less valuable on ARMs than they are on FRMs. Worse yet, borrowers who do not realize points are temporary will end up seeing a bigger payment shock when their loan adjusts.
Consumers who take ARM loans risk a payment shock when rates reset. Initial payments can be quite low during the teaser rate period, but when rates reset after the fixed period of a hybrid ARM loan payments can increase by hundreds of dollars per month from even relatively small moves in interest rates.
While rate shifts may make some loans unaffordable, this factor was not the main cause of the broad decline in marketshare for ARM loans over the past decade.
In addition to general scheduled rate resets, loans which have negative amortization that are recast can have major shifts in monthly repayments. Once again, here is the above displayed table from the CFPB, which shows how those making minimum payments may see their payments rise over time as their rates rise & their loans are recast.

During the bubble the advertised monthly ARM loan payments frequently excluded many common costs of home ownership including taxes and insurance.
Here is typical window marketing for the time.
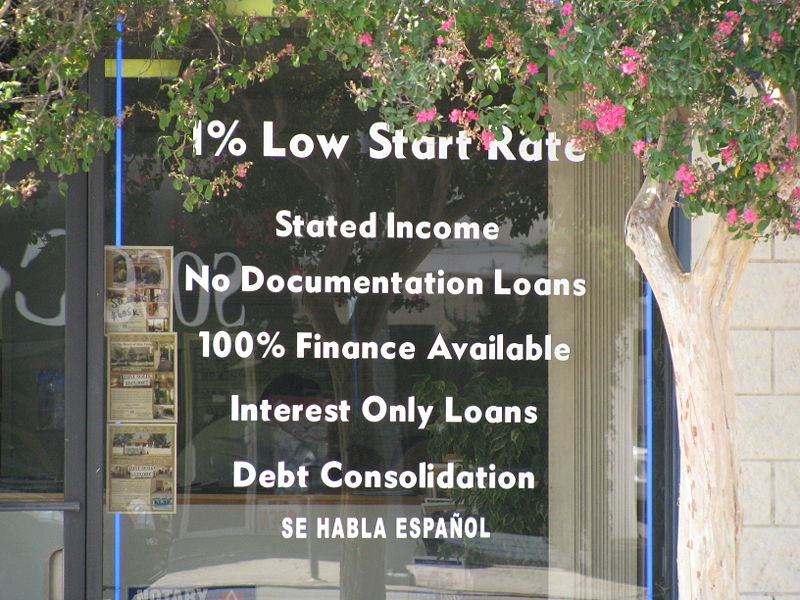
The most widely advertised mortgages catering to marginal borrowers were often the most expensive & most exploitative options. These loans frequently targeted areas with a prevalence of minority, less educated & poor borrowers.
Countrywide was one of the biggest subprime lenders & their CEO's license plate said "fund em." Here is one of their ads.
The following commercial shows how a 3/1 IO styled subprime mortgage might have been marketed during the bubble.
Can you get a $200,000 mortgage for $585 a month? Now you can!
In reality, the cost of such a loan at the then prevailing rate of 7% would have been closer to $1,700 per month if one wanted the loan to amortize in 30 years & included other expenses like property taxes, PMI and homeowner's insurance. This would presume no closing costs & no major home repairs.
It seems every year a major bank gets fined for charging clients the wrong amounts via rigging LIBOR, offering bad exchange rates, robosigning fraudulent documents, creating fake accounts, pushing unneeded force-placed insurance, or other deceptive practices that appear to be "risk free" ways for banks to increase their margins at the expense of their customers.
Most of the major problems associated with ARM loans in the past were associated with predatory lending rather than other errors, but multiple studies have repeatedly shown banks frequently make reference errors in their favor when setting ARM rates.
Buying a home will probably be the biggest financial decision of your life. Make sure you understand your reference rate, margin & how your monthly loan payments might change in the worst case scenario before signing an ARM loan contract.
The CFPB published Consumer handbook on adjustable-rate mortgages, which offers consumers an introductory guide to ARM loans including a mortgage shopping worksheet. We've included an HTML version of their mortgage shopping worksheet below. You can also download this worksheet & bring it to your financial institution. We offer versions in the following formats: PDF, Word & Excel.
| Basic Loan Information | Fixed-Rate Mortgage | ARM 1 | ARM 2 | ARM 3 |
|---|---|---|---|---|
| Name of lender or broker & contact information | ||||
| Mortgage amount | ||||
| Loan term (e.g., 15 years, 30 years) | ||||
| Loan description (e.g., fixed rate, 3/1 ARM, payment-option ARM, interest-only ARM) |
||||
Basic Figures for Comparison |
Fixed-Rate Mortgage | ARM 1 | ARM 2 | ARM 3 |
| Fixed-rate mortgage interest rate and annual percentage rate (APR) (For graduated-payment or stepped-rate mortgages, use the ARM columns) |
||||
| ARM initial interest rate & APR How long does the initial rate apply? |
||||
| What will the interest rate be after the initial period? | ||||
| ARM Features How often can the interest rate adjust? |
||||
| What is the index and what is the current rate? | ||||
| How low could the interest rate go on this loan? | ||||
| What is the payment cap? | ||||
| Can this loan have negative amortization (that is, increase in size)? | ||||
| What is the limit to how much the balance can grow before the loan will be recalculated? | ||||
| Is there a prepayment penalty if I pay off this mortgage early? | ||||
| How long does the penalty last? How much is it? | ||||
| Is there a balloon payment on this mortgage? If so, what is the estimated amount and when would it be due? |
||||
| What are the estimated origination fees and charges for this loan? | ||||
Monthly Payment Amounts |
Fixed-Rate Mortgage | ARM 1 | ARM 2 | ARM 3 |
| What will the monthly payments be for the first year of the loan? | ||||
| Does this include taxes & insurance? Condo or homeowner's association fees? If not, what are the estimates for these amounts? |
||||
| What will my monthly payment be after 2 months if the index rate... ... stays the same? |
||||
| ...goes up 2%? | ||||
| ...goes down 2%? | ||||
| What is the most my minimum monthly payment could be after 1 year? | ||||
| What is the most my minimum monthly payment could be after 3 years? | ||||
| What is the most my minimum monthly payment could be after 5 years? |
For any home loan you are interested in the lender should be able to give you the above information before requiring you to pay any nonrefundable fees. If you remain uncertain after speaking with your lender, please consider contacting a local housing counselor or call the U.S. Department of Housing and Urban Development toll-free at 800-569-4287.
The Federal Reserve has begun lowering interest rates. Lock in today's low rates and save on your loan.
Are you paying too much for your mortgage?
Check your mortgage options with a trusted New York lender.
Answer a few questions below and connect with a lender who can help save you money today!