
The following table shows current 30-year El Monte mortgage rates. You can use the menus to select other loan durations, alter the loan amount. or change your location.

Rhode Island is known as “The Ocean State,” and it is the smallest state in the nation by area, the second most densely populated state, and the eighth least populous state in the nation. The state was formed by merging four settlements together. In 1776, Rhode Island became the first colony to renounce British rule, and it was the fourth colony to adopt the Articles of Confederation. There are several large inlets and bays along the coastline of this state, and this is how it got its nickname.
Rhode Island has a variety of beachfront towns, large cities, and suburban communities. The local living depends on where you choose to settle, and the whole state has a more laid-back vibe that residents enjoy. The state is also very rich in history, and this works to attract many tourists year round. Rhode Island also focuses heavily on green technology, and it was the site of the country's first offshore wind farming operation.
People move to Rhode Island for the beautiful scenery, gorgeous beaches, education opportunities, and the varied economy. The largest cities in Rhode Island are some of the fastest growing in the United States, and the diverse economy also brings younger people to the state who are looking to start their careers. The education opportunities are also a big draw as Rhode Island is home to an Ivy League University, one of the nation's top art schools, one of the top culinary schools, and NCAA sports programs.
However, people move out of Rhode Island for good reasons as well. Rhode Island's cost of living is higher than the national average, and residents pay higher taxes than forty-six other states. Additionally, people can find it very hard to afford to upkeep their cost of living with the higher rate of unemployment and the stagnant economy. This drives people to move to other states in search of work and higher-paying jobs.
People who are secure in their careers find Rhode Island attractive as it is a good place to live if you have a steady income and a higher paying job. People who are also looking for an Ivy League school or who want to go to one of the top-ranked schools in the nation are drawn to Rhode Island.
Rhode Island's housing market started to show signs of a slowdown in early 2006. The market went from a steep climb to a plateau that lasted until the start of 2007. The start of 2006 was also Rhode Island's highest point before it started to fall slowly. From the end of the plateau at the beginning of 2007 until the third quarter of 2007, Rhode Island's housing market entered a steep fall. As the third quarter of 2007 came around, the housing market stopped its steep fall and gradually leveled off until the start of 2008. This started to fall once again, and it fell until the end of 2008 when it abruptly went into a peak. This peak dropped away, and the market fell until it hit a slight plateau in the middle of 2009. This dropped once again until the second quarter of 2011 when it went into a more gradual decline that lasted until the second quarter of 2011. This market peaked one final time in the fourth quarter of 2011 before falling to the lowest point in the second quarter of 2012.
From the second quarter of 2012 until the first quarter of 2014, the market stayed low. It didn't start to recover until the start of 2014, and then it began on a gradual increase that went into a slight peak in the third quarter of 2014. The market spent the second half of 2014 to the second quarter of 2015 in a plateau which hit another slight peak in 2015. The first quarter of 2016 saw the housing market start on a steep increase that has continued into 2017.
The Providence-Warwick Metro experienced a more gradual drop that the state of Rhode Island as a whole. The first quarter of 2016 saw the Metro's housing market hit its highest point, and it went from this point into a slight drop that lasted until the first quarter of 2007. The first quarter of 2007 saw the Metro's housing market begin on a gradual decline that continued until the market went into a slight peak at the start of 2009. This peak marked a period of the only steep drop the Metro's housing market experienced, and it leveled off into another gradual drop by the start of 2010. The market had one more slight peak in 2011 before settling into its lowest point.
When the Metro's housing market hit its lowest point, it stayed low and didn't experience any quick rises until the first quarter of 2014. Since this point, the market has been on an upward trend. It saw very slight peaks in the third quarter of 2014 and in the first quarter of 2016. As of 2017, the Metro's housing market is still on its upward trend, but it hasn't reached the point it was at at the start of 2007.
Both real estate markets experienced similar historical real estate trends. The start of the 1990s saw Rhode Island's real estate market on a slight downward trajectory. This gradual descent went on until the start of 1993 when the market had a significant drop that lasted until the end of 1994. However, the market started to climb quickly until this steep climb leveled out at the start of 1996. Rhode Island's housing market had one more slight drop, and this drop leveled out again in the middle of 1997.
The start of 1998 saw the real estate market begin on a gradual climb that continued through the start of 2001. When 2001 came around, the housing market started on a steeper climb that went largely uninterrupted until it had a very slight decrease in the second quarter of 2003. However, it recovered quickly and went into a slight peak at the end of 2003. The market leveled out again and continued to climb until it hit another slight peak in the third quarter of 2004. As of the start of 2005, Rhode Island's housing market started on a more gradual climb that resulted in the highest point in 2006.
Over the past 30 years the rate of homeownership across the state has ranged between 56% to 65%. Ownership stood at 62% in 1988 before sliding to 56.8% in 1992 and ultimately bottoming out at 56.5% in 1994. Ownership grew throughout the late 1990s tech boom and peaked in 2000 at 61.5% before falling to 59.4% in 2002. Ownership grew throughout the housing bubble to a peak of 64.9% in 2007. After the recession hit ownership has been on the decline, falling to 56.3% in 2016.

Through the first 3 quarters of 2020 real estate held up far better than it did during the 2008 housing recession. Central banks and politicians reacted faster and much more aggressively to the COVID-19 crisis than they did to the 2008 recession. Many novel and unconventional policies which began in response to the prior recession were used much more aggressively in this recession. For instance, here are some of the policies which were enacted:
On November 24, 2020 the Federal Housing Finance Agency (FHFA) raised conforming loan limits by 7.42%, reflecting strong annual growth in the nationwide FHFA House Price Index (HPI). 2022 and 2023 saw limit increases of 18.05% and 12.21%, the fastest 2-year growth rates since 1986 & 1987, and inline with the 15.95% growth in 2006. In 2024 and 2025 the limits were increased at more historically normal levels of 5.56% and 5.21%.
Providence is the sole metropolitan area of the state.
| US Rank | Metropolitan Area | 2016 Pop | 2010 Pop | Change | % △ |
|---|---|---|---|---|---|
| 38 | Providence-Warwick, RI-MA Metro Area | 1,614,750 | 1,600,852 | 13,898 | 0.87% |
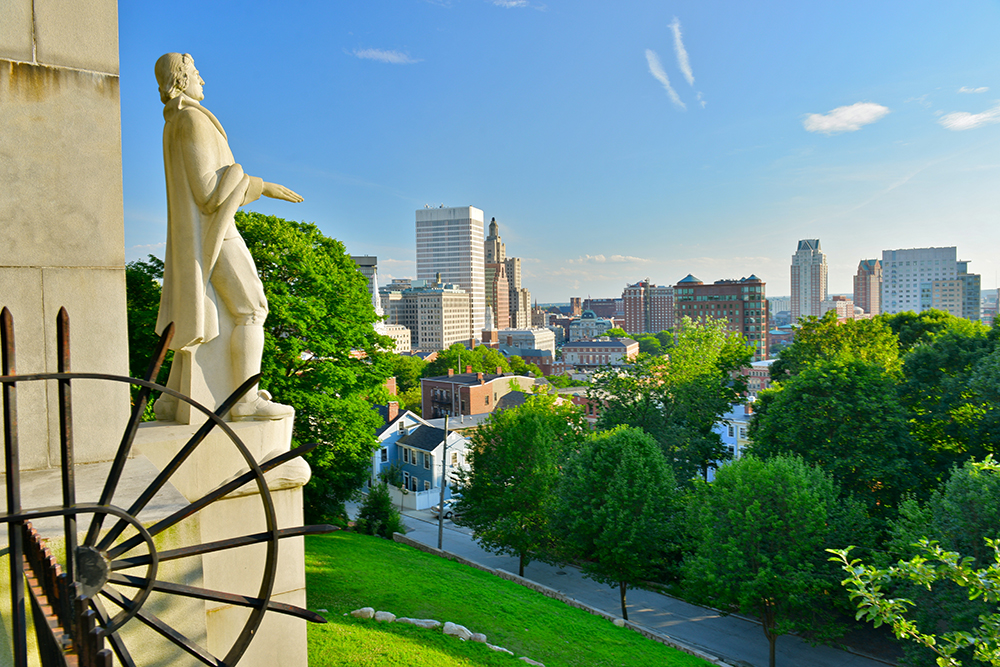
Rhode Island's geography tends to vary considerably. It includes seaports, beachfront settings and modern suburban cities. As a result, Rhode Island’s median home values tend to vary considerably based on the desirability of the area where the home is located.
Rhode Island has a few large cities that contain a large portion of the state's population. These cities are a diverse mix of nationalities, economic opportunities, and educational opportunities that draws a diverse population to them.
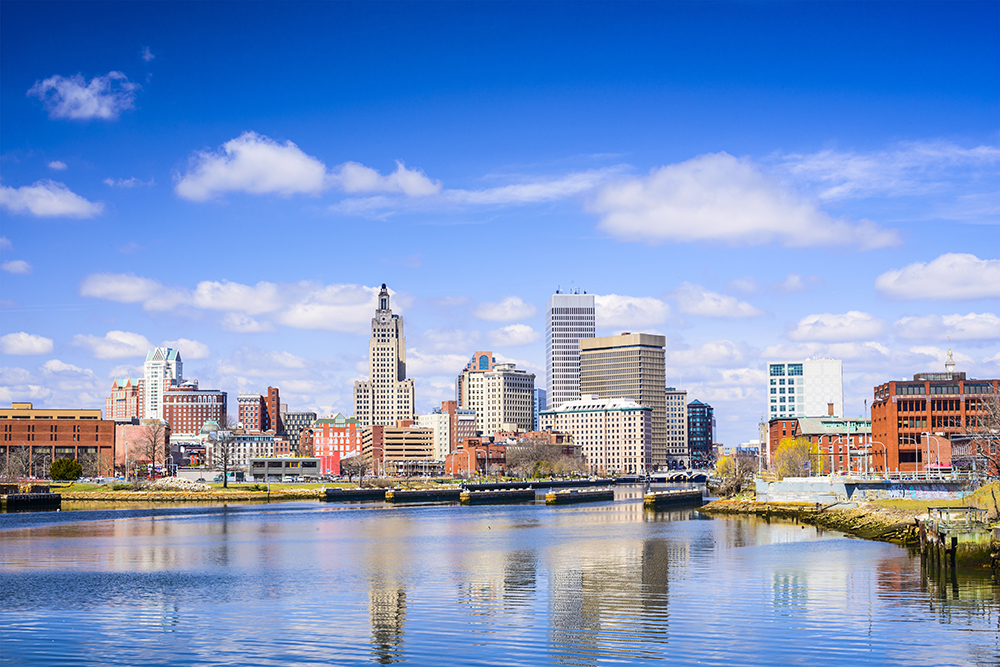
The city with the largest population in Rhode Island is also the state capital, and Providence has 179,219 people. This city is also located in the bigger Providence-Warwick Metro, and there is a population of 1,614,750 people. Providence is the third biggest city in New England, and it has the nickname of the “Creative Capital” due to its education and art community.
The economy has long had ties to the textile industry, along with its jewelry, silverware, and machine tools. This diverse and thriving economic industry started to shift in 2009 when the city rebranded itself to reflect its dedication to the art and education sectors of the economy. Healthcare and government also play a role as this is the capital city of Rhode Island.
This city has two very different "sides" to it. On the good side, it is home to a creative class that features many well-known artists. Furthermore, many creative class residents are also employed by an educational industry that has brought many high paying jobs to the area. On the bad side, it also has had one of the ten worse poverty rates among cities with at least 100,000 residents. As a result, this city has been prone to more foreclosures than other cities in the New England region.
Residents who live in this city and tourist will experience a humid continental climate, and it has warm summers, cold winters, and there is high humidity all year long. This city stays warmer than many of the inland cities due to the influence of the Pacific Ocean. Winter temperatures usually stay around 29 degrees, and the summer temperatures stay around 70 degrees.
The population of Providence loves its coffee, and this city has a higher doughnut and coffee shop per capita than any other town or city in the nation. The Trinity Repertory Company is based here, and this theater group has won several Tony awards for their performances. The Rhode Island School of Design Museum draws hundreds of tourist with its large collection and the WaterFire festival is a huge tourist attraction as well.
Providence has one of the original Ivy League schools and it is also one of the original nine colonial schools in the nation, and Brown University has thousands of students enrolled in a variety of courses. Rhode Island College is the oldest public college in the state, or students can choose to attend Providence College. Additionally, the Providence Public School District has over 30,000 students and twenty-five elementary schools, nine middle schools, and thirteen high schools.
Education and healthcare make up the city's biggest employers, and the biggest employer is Brown University with 4,600 staff members. The second biggest employer is from the healthcare sector, and Rhode Island Hospital has 4,200 staff. The third biggest employer is the Women and Infants Hospital, and it currently has 1,800 people employed.
Despite the diverse economy, Providence has an unemployment rate that is over 1% higher than the national average unemployment rate. It is had over 1.5% job growth in the past year, so this may help improve Providence's economy. In addition to this recent growth, the economy is going to add an estimated 36% more jobs in the coming years.
Providence has a local median home price of $185,700, and this price averages out to $162 per square foot. The median home price and the price per square foot have gone up by 11.8% in the past year, and they're estimated to go up another 4.4% in the coming year. The Providence-Warwick Metro has a local median home price of $199,900, and this comes out to $195 per square foot.
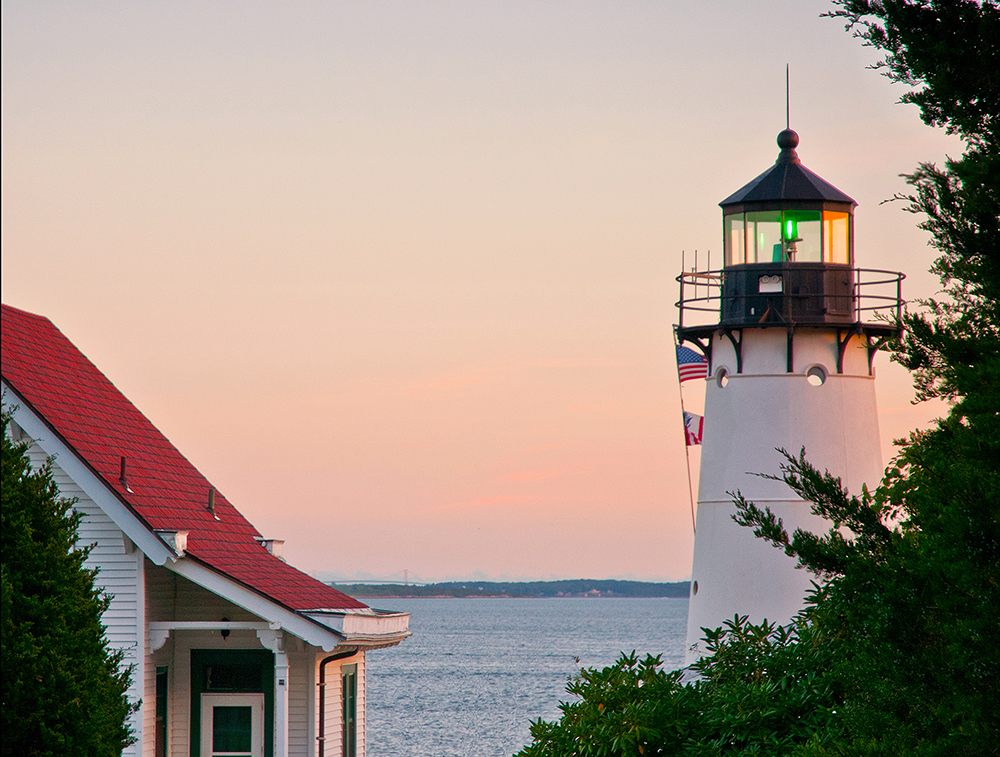
Warwick is the second biggest city in the state of Rhode Island, and it has a 2016 population of 81,579 residents. Warwick is part of the Providence-Warwick Metro, and this Metro has 1,614,750 people. Warwick was a witness to many historical events in the United State's history, and it was founded in 1642.
Warwick's economy is based heavily on the healthcare, education, finance, and retail industries. The city is also home to an airport, the military police brigade, and the Rhode Island national guard chapter. All of these sectors contribute to the overall health of the local economy, and they provide several long-term jobs.
This city sees slightly hotter temperatures than other cities in Rhode Island with June and July's temperatures in the low 80s. January is the coldest month of the year, and temperatures usually stay in the low 20s. The spring months are usually warmer with slightly cooler nights, and the fall months have cooler temperatures and frost in mid-October to early November.
Warwick is home to several historic and entertaining attractions, and you can go on a day trip, romantic getaway, or an extended trip. Tourists come to Goddard State Park to see the beautiful views, scenic hiking trails, and experience the outdoor recreational activities available. The Clouds Hill Victorian House Museum is a historic museum that allows guests to walk through the home. Finally, the Warwick Center for the Arts is a large museum dedicated to showcasing local and regional artists.
Warwick Public Schools serves this city, and this school system currently has over 10,000 students. As for secondary education, there are a few community colleges in Warwick to choose from. The Community College of Rhode Island is located on the former Knight Estate. Students can also choose to attend the New England Institute of Technology.
Warwick's biggest employer is Kent Memorial Hospital, and it has 3,200 staff members. The second biggest employer in Warwick is from the financial sector, and the Citizens Bank employs over 1,200 people. The third biggest employer in Warwick is from the government industry, and the City of Warwick has over 1,000 staff members.
The city's economy is doing well, and it has an unemployment rate that is currently below the national average of over 1%. In addition to this, it has also had job growth in the past year, and Warwick is estimated to add another 38% of jobs to the local economy in the coming years.
Warwick has a local median home price of $214,500, and this price works out to around $177 per square foot. These two prices have gone up over the past year by over 9%, and they're estimated to go up another 3.7% in the coming year. The Providence-Warwick Metro has a local median home price of $199,900, and this comes out to $195 per square foot.
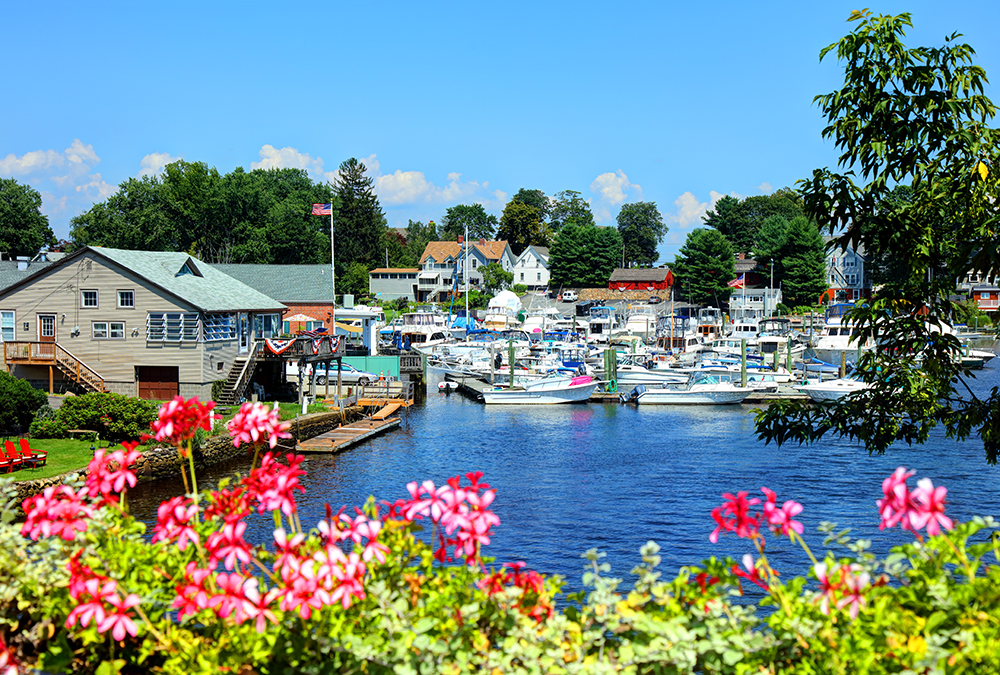
Cranston is the third biggest city in the state of Rhode Island, and it has a population of 81,034 people. In addition to this population, Cranston is part of the bigger Providence-Warwick Metro, and they have a combined population of 1,614,750. This city ranks as one of the safest cities to live in in the nation, and it has been ranked as one of the one-hundred best places to live.
The city was created in 1754, but it wasn't officially a city until 1910 after it lost most of its land to neighboring Providence. Cranston has seen amazing growth in the past decade because it has done a good job expanding its travel and tourism industry. Cranston has also grown because many New Englanders have taken advantage of the area's lower crime rates and wonderful quality of life.
Cranston's economy is diverse, and it is supported by healthcare, finance, government, corrections, tourism, and retail or the service industry. This city has a long history of being very small business friendly, and this has led to a busy downtown sector with lots of smaller boutiques, coffee shops, restaurants, and cafes. There are also several larger companies headquartered here, and this helps to support the economy as well.
This city routinely experiences a humid continental climate with year-round high humidity. In particular, July is the hottest month of the year with temperatures in the low-to-mid 80s with a high humidity index. January is the coldest month of the year with temperatures routinely staying in the mid-20s. Spring is generally very wet and warm with a lot of rainfall.
The Garden City Center is a large shopping complex that has a variety of stores and restaurants. If you'd like to learn a little about the history of beer brewing, the Revival Brewing Company is an excellent place to take a tour. The Roger William Park Zoo is a great family-friendly destination where you can take a day trip. If you like museums, the Museum of Natural History and Planetarium is located in Cranston as well.
Cranston is home to the Cranston Public School District, and this system has several elementary, middle, and high schools as well as alternative schools available. As for secondary education, students can choose to attend the Toni & Guy Hairdressing Academy.
The largest employer in the city of Cranston is the headquarters for the jewelry company Alex & Ani with just over 1,500 employees. The second biggest employer in the city is the headquarters for the Rhode Island Department of Corrections with 1,200 members of staff. Rounding out the top three biggest employers in Cranston is the City of Cranston with around 1,000 staff.
Cranston's economy is stable, and it currently has an unemployment percentage that is just below the national average. There has also been recent job growth in the city to support the economy, and over the next ten years, the city is estimated to add over 38% more jobs to the local economy.
This city has a local median home price of $232,400, and this price averages out to around $177 per square foot. Both of these numbers have gone up by 7.8% in the past year, and they're estimated to go up another 3.3% in the coming year. The Providence-Warwick Metro has a local median home price of $199,900, and this comes out to $195 per square foot.
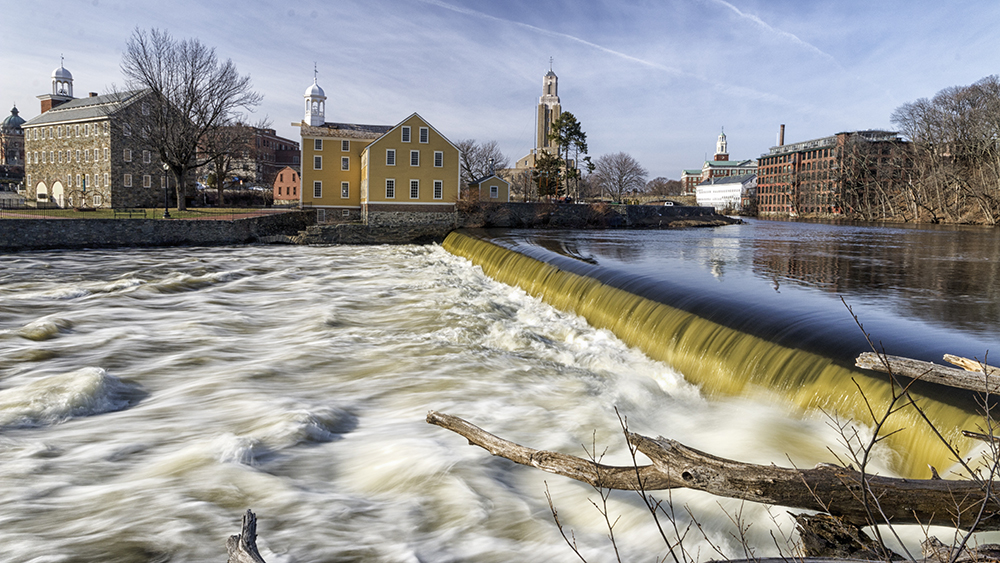
Rhode Island's fourth largest city is the city of Pawtucket with a 2016 population estimate of 71,427 people. Pawtucket is also part of the Providence-Warwick Metropolitan area, and the population of both of these areas is 1,614,750 people. The city's name was derived from the Algonquian language, and it means “river fall.” The entire town was destroyed during King Philip's War, and it rebuilt itself into a thriving city.
Pawtucket has a long history with the textile industry, and in 1973 it became the first cotton-spinning mill in American to be fully mechanized. This eventually evolved as a center for iron working, textiles, and other markets. Today, the economy relies heavily on the tourism, healthcare, business, and the industrial sectors.
Pawtucket has a humid continental climate that is classified by warmer temperatures and higher year-round humidity levels. On average, July is the hottest month of the year with temperatures in the low 80s. Out of the winter months, January is usually the coldest months with temperatures staying between ten and twenty degrees. Springtime brings rainy and warm weather, and the fall months bring cooler temperatures.
This city is dedicated to its arts scene, and the city's historic downtown sector is home to the Arts and Entertainment District. In September of every year, the city hosts a month long Arts Festival that celebrates both famous and local artists. People can visit the Slater Memorial Park and walk through various flower displays and trails as well.
The city is served by the Pawtucket School District, and there are ten elementary schools, three middle schools, and four high schools in this district. There are also several Catholic schools located throughout the city for students to attend. However, there are no colleges or universities for students to attend in Pawtucket.
The biggest employer in Pawtucket is the world headquarters for Hasbro, Inc with over 2,500 employees. The second biggest employer in the city is Tunstall Americas, and it currently has around 1,400 staff members. The employer who rounds out the top three largest employer group for Pawtucket is the City of Pawtucket with over 900 employees.
Despite this diverse economy, Pawtucket's unemployment rate is slightly higher than the national average, but the economy has experienced job growth in the past year. This unemployment rate may go down over the next ten years as Pawtucket is estimated to add another 37% more jobs to the economy.
Currently, Pawtucket has a local median home price of $188,900, and this figure works out to around $161 per square foot. Both of these numbers have increased over the past year by 8%, and they're estimated to go up by another 3.6% in the coming year. The Providence-Warwick Metro has a local median home price of $199,900, and this comes out to $195 per square foot.
According to the United States Census an estimated 1,056,426 people live in the state of Rhode Island. The state has 1,033.81 mi² of land area, which gave it a population density of 1,021.88 per mi². Here is a list of cities, towns & Census Designated Places across the state, with their estimated population as of June 2016 & the 2010 United States Census. For Census Designated Places (CDP) where there was no population estimate available for 2016, the 2011-2015 American Community Survey 5-Year Estimates data was used.
All table columns are sortable. Click on the column headers to sort by that column. Click again to sort low to high. Cities with higher levels of population growth typically see the increased demand drive faster real estate price appreciation.
| Rank | Geography | County | 2016 Pop | 2010 Pop | Change | % △ | Land mi² | Pop Den mi² |
|---|---|---|---|---|---|---|---|---|
| 1 | Providence | Providence | 179,219 | 178,042 | 1,177 | 0.66% | 18.4 | 9,740.16 |
| 2 | Warwick | Kent | 81,579 | 82,672 | -1,093 | -1.32% | 35.04 | 2,328.17 |
| 3 | Cranston | Providence | 81,034 | 80,387 | 647 | 0.80% | 28.34 | 2,859.35 |
| 4 | Pawtucket | Providence | 71,427 | 71,148 | 279 | 0.39% | 8.68 | 8,228.92 |
| 5 | East Providence | Providence | 47,337 | 47,037 | 300 | 0.64% | 13.24 | 3,575.30 |
| 6 | Woonsocket | Providence | 41,406 | 41,186 | 220 | 0.53% | 7.74 | 5,349.61 |
| 7 | Coventry | Kent | 34,996 | 35,014 | -18 | -0.05% | 59.05 | 592.65 |
| 8 | Cumberland | Providence | 34,694 | 33,506 | 1,188 | 3.55% | 26.45 | 1,311.68 |
| 9 | North Providence | Providence | 32,494 | 32,078 | 416 | 1.30% | 5.62 | 5,781.85 |
| 10 | South Kingstown | Washington | 30,791 | 30,639 | 152 | 0.50% | 56.45 | 545.46 |
| 11 | Johnston | Providence | 29,230 | 28,769 | 461 | 1.60% | 23.43 | 1,247.55 |
| 12 | West Warwick | Kent | 28,780 | 29,191 | -411 | -1.41% | 7.79 | 3,694.48 |
| 13 | North Kingstown | Washington | 26,142 | 26,486 | -344 | -1.30% | 43.14 | 605.98 |
| 14 | Newport | Newport | 24,779 | 24,672 | 107 | 0.43% | 7.67 | 3,230.64 |
| 15 | Westerly | Washington | 22,651 | 22,787 | -136 | -0.60% | 29.52 | 767.31 |
| 16 | Bristol | Bristol | 22,305 | 22,954 | -649 | -2.83% | 9.82 | 2,271.38 |
| 17 | Smithfield | Providence | 21,774 | 21,430 | 344 | 1.61% | 26.31 | 827.59 |
| 18 | Lincoln | Providence | 21,709 | 21,105 | 604 | 2.86% | 18.12 | 1,198.07 |
| 19 | Central Falls | Providence | 19,347 | 19,376 | -29 | -0.15% | 1.2 | 16,122.50 |
| Westerly CDP | Washington | 17,957 | 17,936 | 21 | 0.12% | 15.82 | 1,135.08 | |
| 20 | Portsmouth | Newport | 17,344 | 17,389 | -45 | -0.26% | 22.98 | 754.74 |
| 21 | Burrillville | Providence | 16,341 | 15,955 | 386 | 2.42% | 55.03 | 296.95 |
| 22 | Barrington | Bristol | 16,272 | 16,310 | -38 | -0.23% | 8.22 | 1,979.56 |
| 23 | Middletown | Newport | 15,973 | 16,150 | -177 | -1.10% | 12.72 | 1,255.74 |
| 24 | Tiverton | Newport | 15,738 | 15,780 | -42 | -0.27% | 29.05 | 541.76 |
| 25 | Narragansett | Washington | 15,605 | 15,868 | -263 | -1.66% | 13.89 | 1,123.47 |
| 26 | East Greenwich | Kent | 13,111 | 13,146 | -35 | -0.27% | 16.39 | 799.94 |
| 27 | North Smithfield | Providence | 12,352 | 11,967 | 385 | 3.22% | 23.8 | 518.99 |
| Valley Falls CDP | Providence | 12,088 | 11,547 | 541 | 4.69% | 3.5 | 3,453.71 | |
| Newport East CDP | Newport | 11,091 | 11,769 | -678 | -5.76% | 5.74 | 1,932.23 | |
| 28 | Scituate | Providence | 10,566 | 10,329 | 237 | 2.29% | 48.16 | 219.39 |
| 29 | Warren | Bristol | 10,490 | 10,611 | -121 | -1.14% | 6.12 | 1,714.05 |
| 30 | Glocester | Providence | 10,035 | 9,746 | 289 | 2.97% | 54.18 | 185.22 |
| Wakefield-Peacedale CDP | Washington | 8,862 | 8,487 | 375 | 4.42% | 4.88 | 1,815.98 | |
| Cumberland Hill CDP | Providence | 8,439 | 7,934 | 505 | 6.37% | 3.2 | 2,637.19 | |
| Greenville CDP | Providence | 8,419 | 8,658 | -239 | -2.76% | 5.16 | 1,631.59 | |
| 31 | Hopkinton | Washington | 8,116 | 8,188 | -72 | -0.88% | 42.95 | 188.96 |
| 32 | Charlestown | Washington | 7,773 | 7,827 | -54 | -0.69% | 36.45 | 213.25 |
| 33 | Richmond | Washington | 7,613 | 7,708 | -95 | -1.23% | 40.29 | 188.96 |
| Tiverton CDP | Newport | 7,407 | 7,557 | -150 | -1.98% | 4.18 | 1,772.01 | |
| Kingston CDP | Washington | 6,969 | 6,974 | -5 | -0.07% | 1.56 | 4,467.31 | |
| 34 | Exeter | Washington | 6,552 | 6,425 | 127 | 1.98% | 57.47 | 114.01 |
| 35 | West Greenwich | Kent | 6,148 | 6,135 | 13 | 0.21% | 50.26 | 122.32 |
| 36 | Jamestown | Newport | 5,460 | 5,405 | 55 | 1.02% | 9.45 | 577.78 |
| 37 | Foster | Providence | 4,671 | 4,606 | 65 | 1.41% | 50.8 | 91.95 |
| Pascoag CDP | Providence | 4,583 | 4,577 | 6 | 0.13% | 5.01 | 914.77 | |
| Narragansett Pier CDP | Washington | 3,957 | 3,409 | 548 | 16.08% | 3.57 | 1,108.40 | |
| 38 | Little Compton | Newport | 3,504 | 3,492 | 12 | 0.34% | 20.52 | 170.76 |
| Harrisville CDP | Providence | 1,833 | 1,605 | 228 | 14.21% | 0.81 | 2,262.96 | |
| Hope Valley CDP | Washington | 1,733 | 1,612 | 121 | 7.51% | 3.3 | 525.15 | |
| Chepachet CDP | Providence | 1,656 | 1,675 | -19 | -1.13% | 5.47 | 302.74 | |
| Melville CDP | Newport | 1,327 | 1,320 | 7 | 0.53% | 2.09 | 634.93 | |
| Bradford CDP | Washington | 1,158 | 1,406 | -248 | -17.64% | 1.82 | 636.26 | |
| Ashaway CDP | Washington | 1,108 | 1,485 | -377 | -25.39% | 2.38 | 465.55 | |
| 39 | New Shoreham | Washington | 906 | 1,051 | -145 | -13.80% | 9.08 | 99.78 |
| Harmony CDP | Providence | 876 | 985 | -109 | -11.07% | 2.92 | 300.00 | |
| Greene CDP | Kent | 863 | 888 | -25 | -2.82% | 6.07 | 142.17 | |
| Carolina CDP | Washington | 787 | 970 | -183 | -18.87% | 2.46 | 319.92 | |
| Quonochontaug CDP | Washington | 558 | 333 | 225 | 67.57% | 1.31 | 425.95 | |
| Weekapaug CDP | Washington | 430 | 425 | 5 | 1.18% | 1.16 | 370.69 | |
| Misquamicut CDP | Washington | 349 | 390 | -41 | -10.51% | 1.17 | 298.29 | |
| Foster Center CDP | Providence | 325 | 355 | -30 | -8.45% | 2.17 | 149.77 | |
| Watch Hill CDP | Washington | 184 | 154 | 30 | 19.48% | 0.8 | 230.00 | |
| Clayville CDP | Providence | 159 | 300 | -141 | -47.00% | 1.72 | 92.44 | |
| Wyoming CDP | Washington | 96 | 270 | -174 | -64.44% | 0.83 | 115.66 |
Annual Estimates of the Resident Population: April 1, 2010 to July 1, 2016
Source: U.S. Census Bureau, Population Division
Release Date: May 2017.
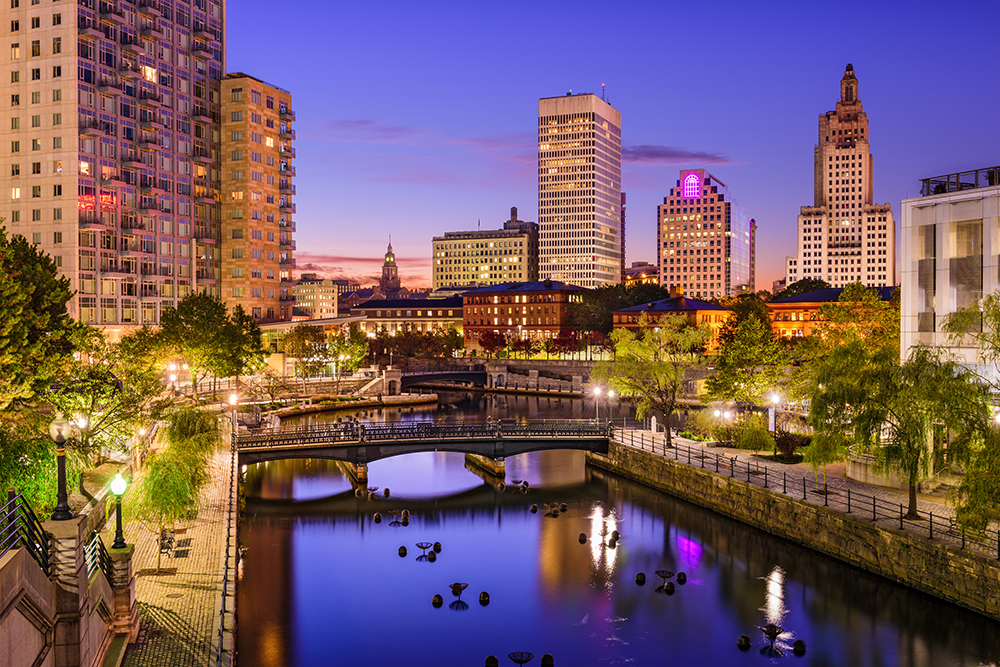
As of 2025 the conforming loan limit across the United States for single-family homes was set to $806,500, with a ceiling of 150% that amount in HERA high-cost areas where median home values are higher. High local affordability makes the $806,500 ceiling apply statewide for single unit homes. Dual unit homes have a limit of $1,032,650, triple unit homes have a limit of $1,248,150 & quadruple unit homes have a limit of $1,551,250. Home buyers who are borrowing more than the above amounts to purchase premium Providence properties will likely need to obtain a jumbo mortgage. Jumbo loans typically have a slightly higher rate of interest than conforming mortgages, though spreads vary based on credit market conditions.
Several different types of home loans are available in the Ocean State. Fixed-rate loans are very common, and the terms include thirty, twenty, fifteen, and ten years. The longer the life of the mortgage, the lower the monthly payment will be, which is why the 30-year loan is the most popular. The downside of this, however, is that the APR is higher compared to shorter-term loans. The difference can be as large as a full percentage point.
In addition to conventional 30-year and 15-year fixed-rate mortgages, lenders offer a wide variety of adjustable rate mortgages (ARM’s). While these instruments have lost some of their attractiveness during the recession, there are still circumstances where they offer the only way for a borrower to qualify. Properly structured (that is, with strict limits on how much the rate can fluctuate), such loans are still a legitimate way for borrowers to purchase a home and start building equity while establishing their credit so as to qualify for conventional loans upon the ARM’s expiration. These loans provide interest rates that fluctuate, as the name implies. The APR is usually fixed for an initial term, such as three, five, seven or ten years. Then the rate adjusts depending on the performance of a referenced index rate, usually once per year; but it can change more frequently. The loan agreement may state in detail how frequently the APR can change, and it may also include a rate cap to prevent large changes.
Balloon mortgages are another route for aspiring homeowners. Balloon mortgages are when a large portion of the borrowed principle is repaid in a single payment at the end of the loan period. Balloon loans are not common for most residential buyers, but are more common for commercial loans and people with significant financial assets.
A few lenders in the Ocean State offer interest-only loans, but usually only for periods of three years. These are mortgages where payments are applied only to interest for a period of time. The loan's principal isn't paid down, so the monthly payments are very low. The low monthly payments only lasts a few years, however. Typically, it's about three years. After this period, monthly payments spike because the loan's principal hasn't been reduced & the remainder of the loan must be paid off in a compressed period of time. For example, on a 3 year IO 30-year loan, the first 3 years are interest only payments, then the loan principal must be paid in full in the subsequent 27 years.
When qualifying for a loan, a credit score of 720 or better can help secure a favorable loan. Some mortgage lenders in the Providence area have approved borrowers with credit scores around 640. The best rates and deals will be obtained with a score above 740. There is a lot of competition among lenders, and this environment can create nice perks for borrowers. For example, some banks will offer special deals on closing costs for borrowers who qualify. The cost might be added to the mortgage or the bank will pay the closing costs but add a few basis points to the APR.
A debt-to-income ratio of 40% and a down payment of 20% are what most banks want to see on a home loan application. They will accept worse numbers, but fees and APR's could go up as a result. Also, a down payment of less than 20% typically results in required mortgage insurance. This down payment requirement does not apply for Federal assistance programs such as FHA, in which applicants can have a lower credit score and income but still receive financing.
The piggyback loan is another type of mortgage which is simply two mortgages in one. The piggyback loan can eliminate the need for private mortgage insurance by covering 80% of the home's value with the first loan, while the second loan helps to pay for part of the down payment.
Prospective home buyers who don't find what they're looking for at one of the state's private banks may want to take a look at some of the mortgage options the federal government offers. One of them is the loan program at the Veterans Administration, which provides mortgages with zero down. On top of that great deal, VA loans do not require private mortgage insurance. The agency does, however, charge a funding fee, and this varies from 1.2% to 3.3%. Making a voluntary down payment will reduce this charge. And in case you're wondering, yes you do have to be a qualified veteran to get one of these unbeatable deals.
If you're not a vet, you may want to consider the Federal Housing Administration's home loan services. The FHA offers loans to people who have a credit score of at least 580 and who can put at least 3.5% down. The government agency also offers mortgages for lower credit scores, but it requires more money down with these loans.
USDA loans can help people with low incomes in rural parts of the state qualify for a subsidized low-interest loan. Given the low population density throughout most of the state, most areas qualify.
Rhode Island's housing authority has a few home loan programs that are designed to help the residents of the state afford a mortgage. These programs usually come with things like lower interest rates and fee help.
First Down RI
The First Down program is a down payment assistance program available to help home buyers afford to pay the costs and fees associated with purchasing a home. This program does have limits and eligibility restrictions that vary from county to county, so it is a good idea to contact your local office.
In order to apply and be approved for this particular program, the applicant must be a first-time home buyer who is looking to buy a one to four bedroom home or condominium. The applicant must also be able to meet the income limits, plan to live in the home as a primary residence and get a home loan to buy the property through the Rhode Island Housing Authority.
This funding comes in the form of a second mortgage that will be added to the original mortgage. However, the funding for this program is forgivable, and after living in the home for at least five years and making on-time payments, the balance is taken away, and the applicant doesn't have to pay the second mortgage anymore. Here are the program limitations:
Rhode Island Refi Program
The Rhode Island Refi Program is designed to help homeowners who have mortgages that are currently underwater. This means that the homeowner currently owns more on their home than the home is worth. With this program, Rhode Island home buyers can refinance their current mortgage based off the current market price of the home.
There are several key aspects that the homeowner has to be aware of and be able to meet before they're considered eligible for this program. Currently, the eligibility requirements for this program are:
If an applicant can meet all of these requirements, there are also income and loan limits to be aware of. First, the loan has a maximum cap of $424,100 for a one to four bedroom home, and $75,000 of this loan will be forgiven after five years. Additionally, the applicant will have to meet the income limits of $87,360 for a one or two person household or $101,920 for a three or more person household.
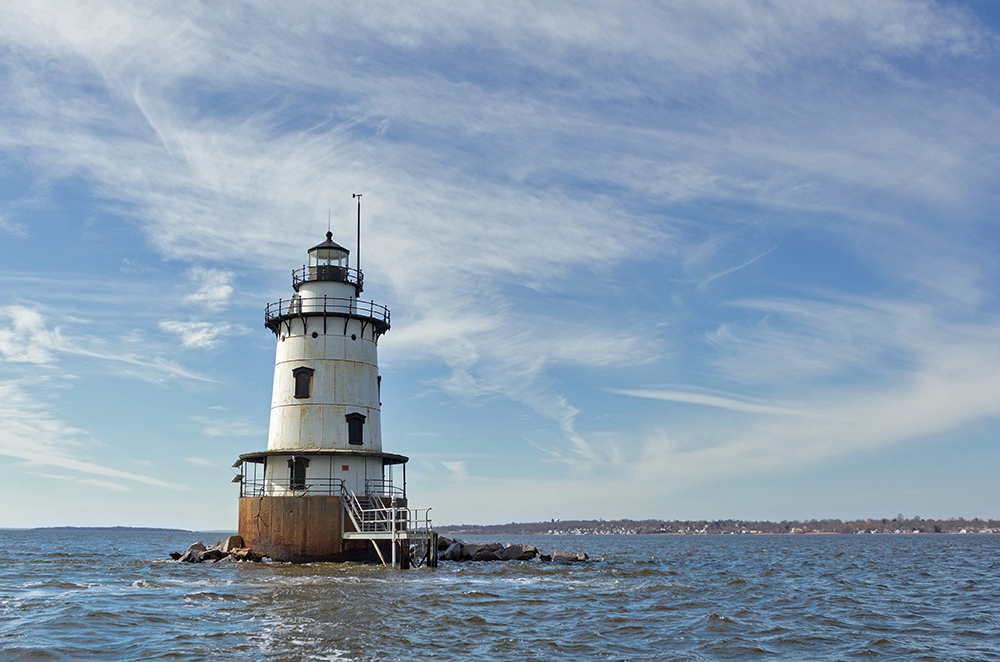
The state of Rhode Island has a very low risk of wildfires, tornadoes & earthquakes. Bristol, Providence & Washington counties have a low risk of hail, while other counties have a very low risk of hail.
Homeowner's insurance policies typically do not cover flooding. Here are counties across the state which have a risk profile above very low for either flooding or hurricane storm surges.
Home buyers with mortgages in high-risk areas are required to buy flood insurance. Most flood insurance policies are sold by the United States federal government through The National Flood Insurance Program. Under-priced flood insurance in high-risk areas act as a subsidy to wealthy homeowners.
The NFIP does not charge nearly enough to cover the expected costs of its liabilities. The assessments are not sufficient to build any buffer to cover an extraordinary year, such as what occurred with Hurricane Katrina in 2005 or Hurricane Sandy in 2012. Because homeowners don't incur the full cost of building in a flood zone we end up with more houses there than if homeowners incurred the full cost of the flood risk, which exacerbates the government's costs in the next disaster.
Typically, homes built after 2002, when building code regulations tightened, are subject to lower insurance rates than older homes. On the other hand, homes without hurricane straps, with roofs that do not meet current standards for wind, with older plumbing or with outdated electrical systems may be difficult or very expensive to insure.
Homeowners who live in lower risk areas & are not required to purchase flood insurance heavily cross-subsidize homeowners who are in areas where floods are more common.
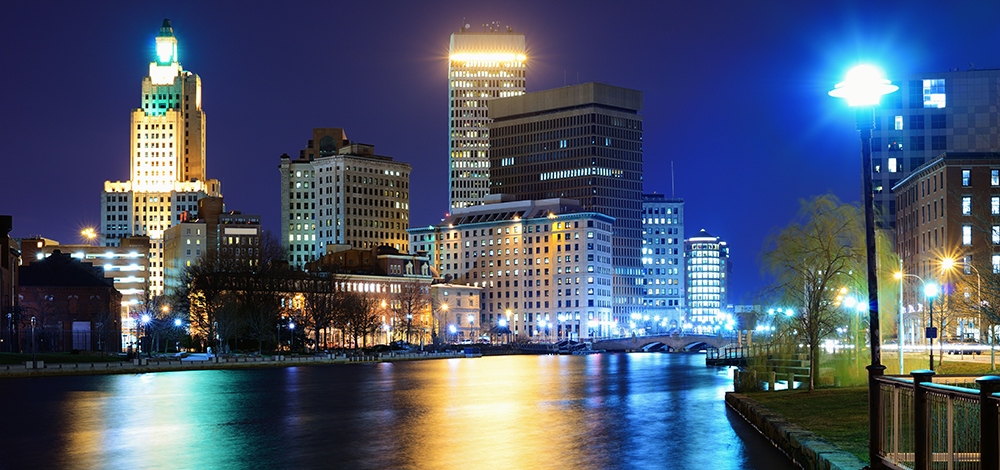
Rhode Island has the eighth-highest property tax rate in the United States with an average tax assessment on single family homes of $5,195 per year in 2016. Given median home prices of $316,486 that yields an annual assessment of 1.64% compared against the national average of 1.24%. Many dwellings in the state are not single family homes. When these other properties are mixed into the overall average it drops the median property value to $267,100, with annual property taxes of $3,618.
This total works out to be 4.92% of the property owner's assessed yearly income. These property tax values do vary from county to county, and currently, Bristol County collects the highest rates in the state with $4,477 in property taxes every year. Providence County is the county that currently collects the lowest property tax rate at $3,380 per year.
Rhode Island's Hardest Hit Fund
The state of Rhode Island created the Hardest Hit Fund to help homeowners who were struggling after the housing market collapse. This program was designed with the goals of preventing foreclosure, stabilizing Rhode Island's housing market, and to help keep families living in their homes.
The homeowner who applies for this program will have to provide documentation of their hardship to be considered eligible for this program, but once they get approval, the Hardest Hit Fund helps by:
In Rhode Island home loans are recognized as either mortgages or deeds of trust. As a general rule, most notes for home loans are converted into mortgages unless the lender and borrower agree to terms of a deed of trust contract. Most modern Rhode Island home loans have a "Power of Sale" clause that aids in any foreclosure proceeding. These "Power of Sale" clauses usually give the lender the ability to conduct a non-judicial foreclosure to repose a defaulted property.
Rhode Island allows mortgage lenders to go through both judicial and nonjudicial foreclosures. This means that a mortgage lender can either foreclose on a property through the court system, or they can foreclosure without involving the court system. Most mortgage lenders choose to have a nonjudicial foreclosure as they typically have a faster process than the judicial process.
The state of Rhode Island is also considered to be a recourse state, and this means that the mortgage lender is allowed to sue a defaulted borrower if there is a deficiency after the foreclosure process is over. A deficiency means that the property in question sold for less than was owed on it during the foreclosure process.
For example, if the borrower purchased the property for $250,000 and defaulted on it, the mortgage lender will typically sell the home at a foreclosure auction. If the property sold for $210,000, there would be a deficiency of $40,000. This amount is what the mortgage lender can sue the defaulted borrower for, and this can mean the defaulted borrower will have their bank accounts levied and their wages garnished.
Most home loans made in Rhode Island have recourse privileges. However, most borrowers have up to three years to redeem a property. This makes obtaining a deficiency judgment very difficult. Furthermore, it is technically possible for the borrower to bid on his own foreclosed home in Rhode Island. As a result, most deficiency lawsuits can take a long time to settle.
Rhode Island's Foreclosure Processes
Rhode Island recognizes at least four procedures that can be used to foreclose on a property:
As a general rule, the non-judicial foreclosure is the most common procedure that is used to foreclose on a property in Rhode Island.
Here is a brief synopsis of how Rhode Island's foreclosure procedures work:
How Rhode Island's judicial foreclosure process works:
It is used only when there is no valid power of sale clause in the mortgage or deed of trust. Whenever there is no valid power of sale clause in the loan instruments, lenders must follow these procedures to obtain a judicial foreclosure order:
How the non-judicial foreclosure procedure works in Rhode Island:
The non-judicial foreclosure procedure works in Rhode Island only if there is a legally binding power of sale clause included in the mortgage note or deed of trust document. If there is such a clause, the lender must do the following things to foreclose on a home in Rhode Island:
Borrowers may also voluntarily surrender a home. Instead of going through the heartache of a foreclosure process, many borrowers voluntarily surrender their homes to lenders. To do this, borrowers must do the following:
Finally, a lender may also foreclose by simply taking peaceful possession of the property. To do this, the lender must do these things:
Check out the following websites to learn more about the Rhode Island real estate market.
The Federal Reserve has begun lowering interest rates. Lock in today's low rates and save on your loan.
Are you paying too much for your mortgage?
Check your mortgage options with a trusted El Monte lender.
Answer a few questions below and connect with a lender who can help save you money today!