
The following table shows current 30-year El Monte mortgage rates. You can use the menus to select other loan durations, alter the loan amount. or change your location.

South Carolina is an alluring destination for potential residents. From the multitude of coastal destinations such as Myrtle Beach, residents can also visit historic colonial sites and a variety of state parks. With a business friendly environment and growing job market, there is an abundance of professional and blue collar jobs. Despite rising home costs and concerns over housing supply, the palmetto state has a very reasonable cost of living, and mortgages are very reasonable as well.
South Carolina real estate trends show a gradual upswing, but are in keeping with or below the national average. For residents, the cost of homeownership does not exceed the state's average income in most places. As data suggests, the current trend is a gradual increase in the price of homes and condos. As of July 1, 2016 the state has an estimated 2,236,153 housing units.
According to Trulia, the average price for a new house in South Carolina is $145,000, which is a good deal under the national average of $200,700. However, this will vary upon region: oceanfront property in areas like North Myrtle will be more expensive.
According to NeighborhoodScout, the highest appreciating cities in South Carolina since 2000 are McClellanville, Folly Beach, Mount Pleasant, Sullivan's Isand, Kiawah Island, and Charleston. These cities are all located along the state's coast, making them beachfront locations with easy access to the many activities the coast offers.
However, keep in mind that these are prime destination in the state; overall, the cost of living in South Carolina is still much lower than other places in the country- especially for beach adjacent properties.
Prices for condos vary upon region and location as well. Prices for a two bedroom condo with 1000 square feet in the inland city of Columbia can be as low as $80,000; while for roughly the same size a condo can cost $700,000 in the coastal town of Hilton Head Island. The median price for condos statewide is currently around $140,000. This is still much cheaper than buying waterfront condos in Los Angeles or Miami, which can cost into the tens of millions. It should be noted that South Carolina has a very modest tax rate when compared to other locations such as California, especially property tax.
Based on information from the Federal Reserve Economic Data (FRED) website, the overall economy and housing market in South Carolina were relatively stable for the early part of the 21st century. In fact, the housing market was on a gradual upswing. Following the recession in 2008, much like the rest of the country, the market slumped in 2009-2010. From 2013 and onward, the housing market and economy have rebounded, with robust growth even higher than pre-recession figures. Tourism, manufacturing, and construction are leading the charge of growth in the state.
Because of the recession, construction of new homes was halted from 2008 to 2010. This has contributed to the current housing shortage; as the economy is now strong and builders are trying to keep up with the demand for homes. Cities like Charleston and Greenville are seeing booms in their housing industries. Many of these city's economic growth is largely due to construction since people continue to buy homes and move to those locations.
Data from the South Carolina Realtors Association reports a steady growth in the housing market in recent years. Housing costs in Charleston are up by 11.5%; housing costs in the greater Myrtle Beach area are up 12%; and housing costs in Columbia are up 8.6%. Condos are on the rise as well, going up 4.9% with a median price of $140,000. Even with rising costs, housing prices remain below or very close to the national average. This rise has to do with an expanding economy, but also housing shortages keeping up with demand remain a problem.
Since 1985 homeownership across the state has remained above 67%, with the rate peaking out at 77.5% in 2002 & falling to 68.9% in 2016.
In comparison to much of the country, South Carolina's housing market is healthy & robust. According to data from Case and Shiller Home Price Index, one of the most popular housing market data sources, cities such as Las Vegas still haven't recovered from pre recession figures.
Through the first 3 quarters of 2020 real estate held up far better than it did during the 2008 housing recession. Central banks and politicians reacted faster and much more aggressively to the COVID-19 crisis than they did to the 2008 recession. Many novel and unconventional policies which began in response to the prior recession were used much more aggressively in this recession. For instance, here are some of the policies which were enacted:
On November 24, 2020 the Federal Housing Finance Agency (FHFA) raised conforming loan limits by 7.42%, reflecting strong annual growth in the nationwide FHFA House Price Index (HPI). 2022 and 2023 saw limit increases of 18.05% and 12.21%, the fastest 2-year growth rates since 1986 & 1987, and inline with the 15.95% growth in 2006. In 2024 and 2025 the limits were increased at more historically normal levels of 5.56% and 5.21%.
| SC Rank | US Rank | Metropolitan Area | 2016 Pop | 2010 Pop | Change | % △ |
|---|---|---|---|---|---|---|
| 1 | 22 | Charlotte-Concord-Gastonia | 2,474,314 | 2,217,012 | 257,302 | 11.61% |
| 2 | 61 | Greenville-Anderson-Mauldin | 884,975 | 824,112 | 60,863 | 7.39% |
| 3 | 71 | Columbia | 817,488 | 767,598 | 49,890 | 6.50% |
| 4 | 74 | Charleston-North Charleston | 761,155 | 664,607 | 96,548 | 14.53% |
| 5 | 93 | Augusta-Richmond County | 594,919 | 564,873 | 30,046 | 5.32% |
| 6 | 118 | Myrtle Beach-Conway-North Myrtle Beach | 449,295 | 376,722 | 72,573 | 19.26% |
| 7 | 153 | Spartanburg | 329,136 | 313,268 | 15,868 | 5.07% |
| 8 | 210 | Hilton Head Island-Bluffton-Beaufort | 211,614 | 187,010 | 24,604 | 13.16% |
| 9 | 215 | Florence | 205,976 | 205,566 | 410 | 0.20% |
| 10 | 360 | Sumter | 107,396 | 107,456 | -60 | -0.06% |
| 11 | 402 | Greenwood | 95,005 | 95,078 | -73 | -0.08% |
| 12 | 414 | Orangeburg | 87,903 | 92,501 | -4,598 | -4.97% |
| 13 | 459 | Seneca | 76,355 | 74,273 | 2,082 | 2.80% |
| 14 | 518 | Georgetown | 61,399 | 60,158 | 1,241 | 2.06% |
| 15 | 547 | Gaffney | 56,646 | 55,342 | 1,304 | 2.36% |
| 16 | 723 | Newberry | 38,079 | 37,508 | 571 | 1.52% |
| 17 | 844 | Bennettsville | 26,945 | 28,933 | -1,988 | -6.87% |
Most of South Carolina's popular destination are along its coast. The state's cities range from laid back and historic such as Charleston, to having more of a touristy, fun attitude in places like Myrtle Beach. South Carolina does not have the same volume as New York or Chicago, but instead has many smaller cities with a less urgent attitude. The highest appreciating cities in South Carolina since 2000 are McClellanville, Folly Beach, Mount Pleasant, Sullivan's Isand, Kiawah Island, and Charleston. These cities are all located along the state's cost, making them beachfront locations with easy access to the many activities the coast offers.
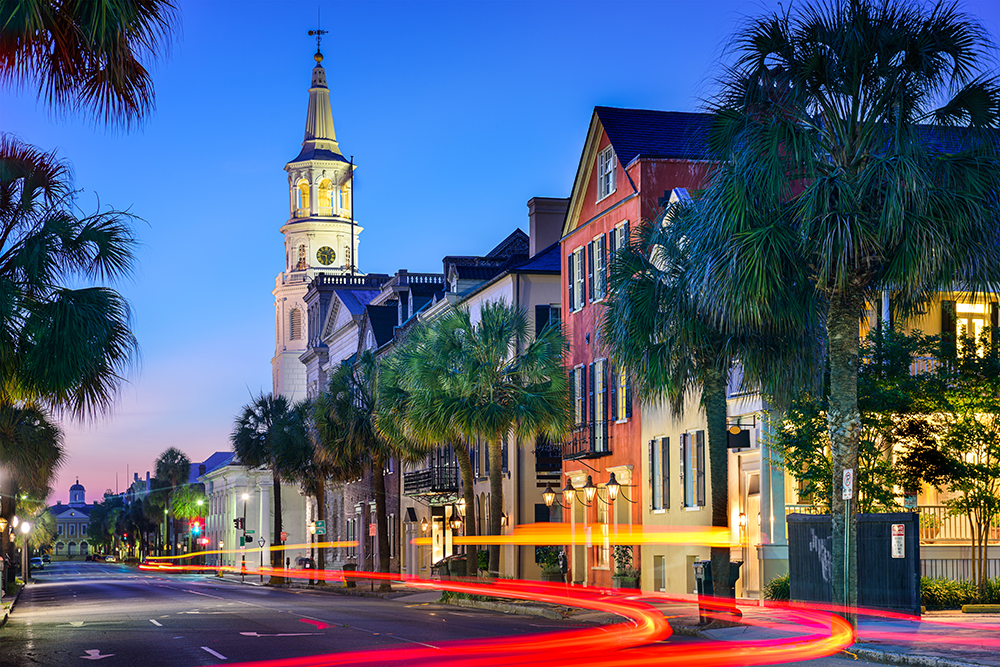
Charleston, South Carolina's biggest city of 134,000, is known for its beach proximity and colonial character. There are many historic sites dating back to the Revolutionary War era, while the city boasts contemporary entertainment such as live theatre, museums, and Southern music. This area also consists of North Charleston and Summerville to form a metro population of 664,607. Besides a large amount of tourism and hospitality related jobs, the area is experiencing a growing IT sector.
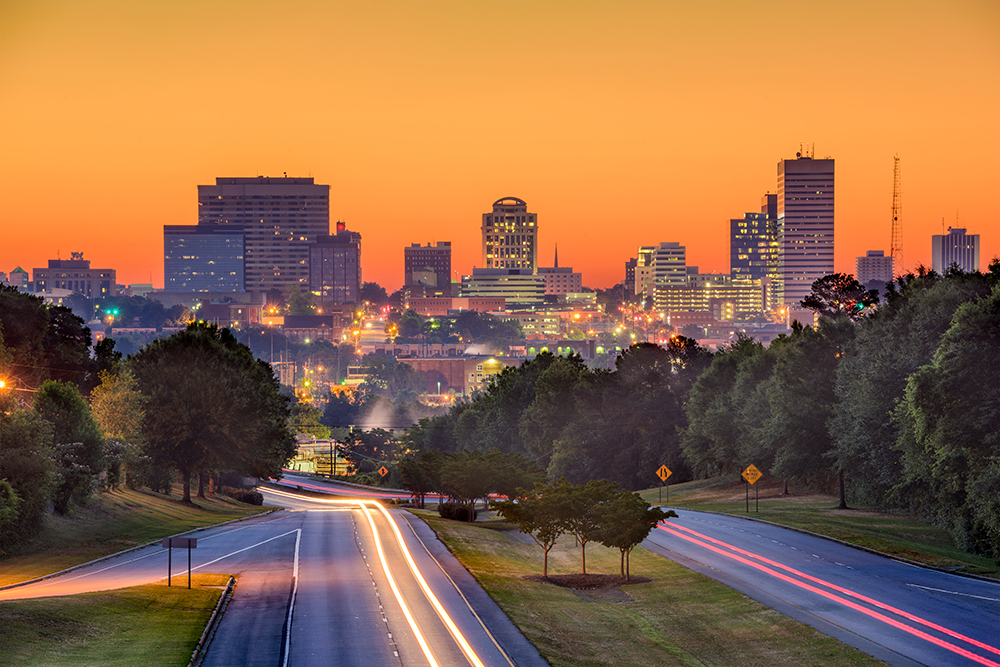
Columbia is South Carolina's second largest city and capital. Besides being the administrative center of the state, other employers include Palmetto Health hospital system, Blue Cross and Blue Shield, and the University of South Carolina. Located further inland, it is a distance from the coast but still has plenty to do such as museums, parks, and a zoo. Columbia is considered less happening than its counterpart Charleston, but the city has experienced a downtown revitalization in recent years. Because the city is near two major rivers, it's considered a kayak and canoe destination for both tourists and residents alike. Columbia has been ranked by US News & World Report as one of "America's Best Affordable Places to Retire."
U.S. News and World Report states the average home price in Charleston is roughly $220,000- slightly above the national average. Other cities such as Folly Beach and Kiawah Island can boast median home costs upward of $600,000 and $950,000 respectively. In Columbia however, the average cost of a home is $130,00- or $84 per square foot. The housing trend seems to be that the closer to the beach and ritzier, the more expensive property tends to be.
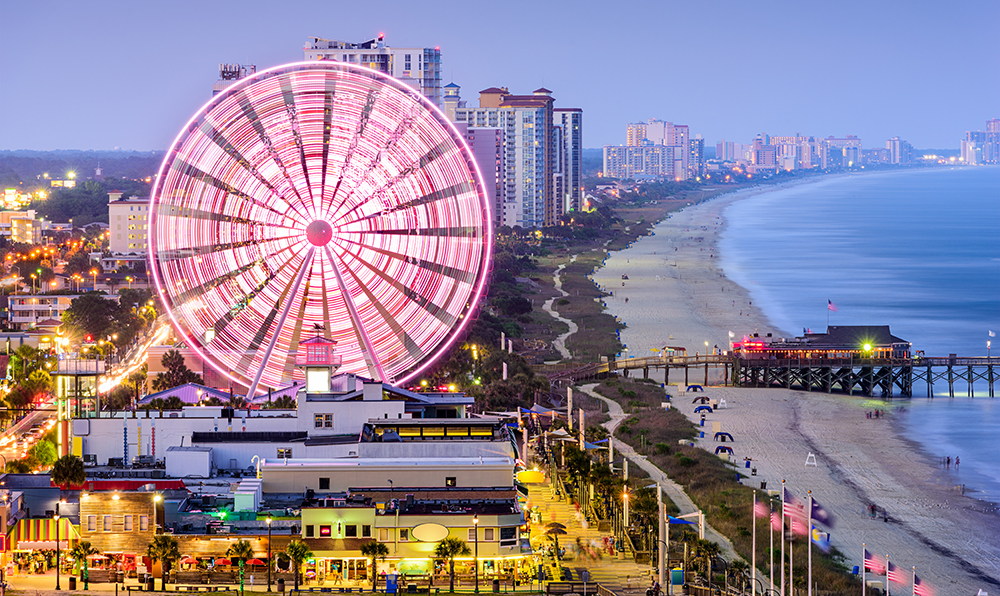
Myrtle Beach is possibly the state's most popular destination for visitors and residents alike. The area also comprises North Myrtle, both cities having population of around 32,000 and 16,000 respectively. Myrtle Beach has a beach-goer atmosphere with boardwalks, themed restaurants and parks, and amusement rides. Tourism and hospitality are large factors of the local economy.
For those who want a beach town, but don't want the large crowds Myrtle draws, then Folly Beach is a good destination. Located 11 miles south of Charleston, Folly Beach has a population less than 3,000 people. This small, private town still has plenty to do but with a much smaller and laid-back atmosphere. However, this does come with a greater price tag. Houses tend to go for much higher than the state average.
Greenville is one of South Carolina's larger towns, located in the North-Western part of the state. With a population of 67,453 it is considered a desirable place to live with several universities, museums, and a zoo. The city serves as the North American headquarters for Michelin, AVX Corporation, Ameco, and is home to a Lockheed Martin aircraft logistics center.
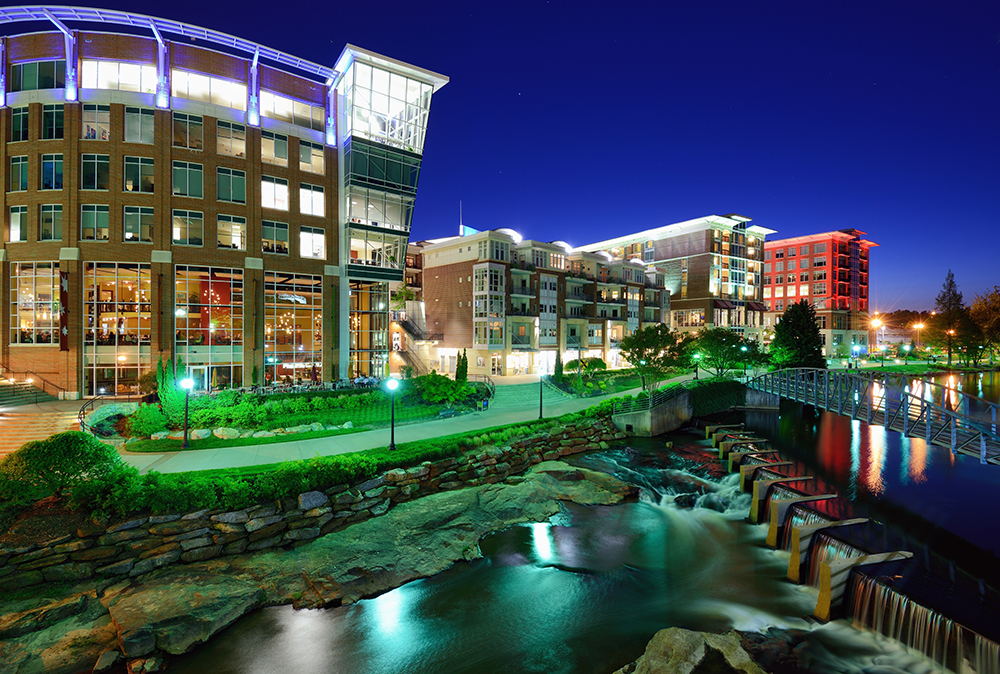
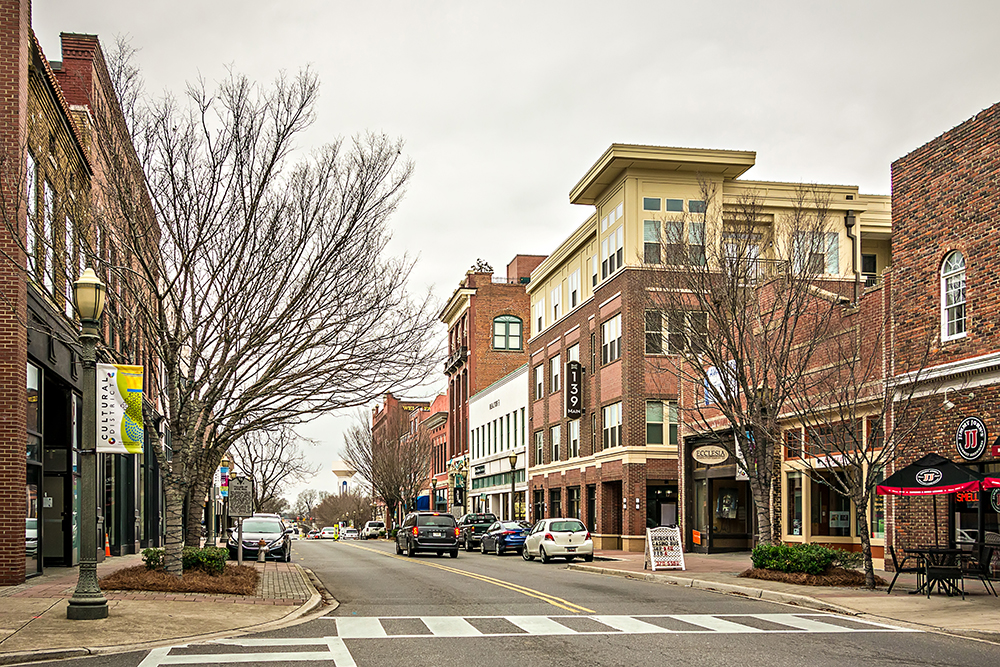
Rock Hill is conveniently located 15 miles south of Charlotte, North Carolina and 70 miles north of Columbia. Rock Hill is home to three universities, several major roads and an airport that houses private jets. Rock Hill maintains 31 parks, 4 recreation centers and encourages residents to participate in Geocaching, a treasure hunting game.
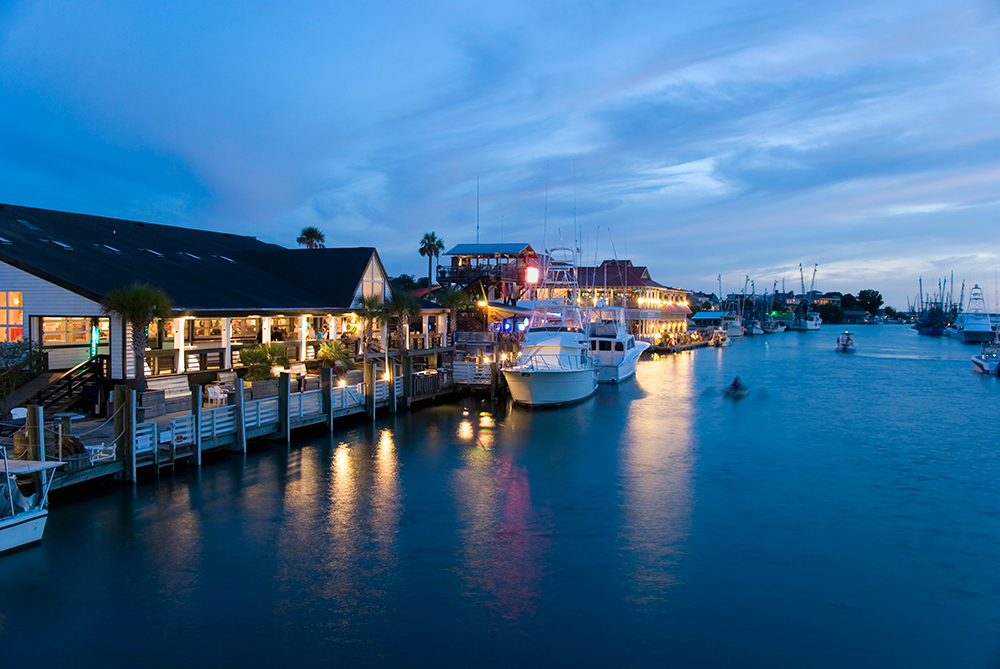
Mount Pleasant was the fastest growing city heading into this century, doubling its residents between 1990 and 2000. This city is home to a naval and maritime museum and home to the World War II aircraft carrier USS Yorktown, which is now a museum ship.
As of July 1, 2016 the state of South Carolina has an estimated population of 4,961,119 across 30,060.7 mi² yielding a population density of 165.04 people per mi² across the state.
The following table highlights the July 1, 2016 populations of cities, towns & Census Designated Places (CDP) with over 2,500 residents based on United States Census Bureau estimates. For Census Designated Places (CDP) where there was no population estimate available for 2016, the 2011-2015 American Community Survey 5-Year Estimates data was used.
All table columns are sortable. Click on the column headers to sort by that column. Click again to sort low to high. Cities with higher levels of population growth typically see the increased demand drive faster real estate price appreciation.
| Rank | Geography | County | 2016 Pop | 2010 Pop | Change | % △ | Land mi² | Pop Den mi² |
|---|---|---|---|---|---|---|---|---|
| 1 | Charleston | Charleston & Berkeley | 134,385 | 120,083 | 14,302 | 11.91% | 108.98 | 1,233.12 |
| 2 | Columbia | Richland & Lexington | 134,309 | 129,272 | 5,037 | 3.90% | 132.21 | 1,015.88 |
| 3 | North Charleston | Charleston, Dorchester & Berkeley | 109,298 | 97,471 | 11,827 | 12.13% | 73.19 | 1,493.35 |
| 4 | Mount Pleasant | Charleston | 84,170 | 67,843 | 16,327 | 24.07% | 45.08 | 1,867.13 |
| 5 | Rock Hill | York | 72,937 | 66,154 | 6,783 | 10.25% | 35.72 | 2,041.91 |
| 6 | Greenville | Greenville | 67,453 | 58,409 | 9,044 | 15.48% | 28.67 | 2,352.74 |
| 7 | Summerville | Dorchester, Berkeley & Charleston | 49,323 | 43,392 | 5,931 | 13.67% | 18.04 | 2,734.09 |
| 8 | Goose Creek | Berkeley & Charleston | 42,039 | 35,938 | 6,101 | 16.98% | 40.09 | 1,048.62 |
| 9 | Sumter | Sumter | 40,723 | 40,524 | 199 | 0.49% | 32.09 | 1,269.02 |
| 10 | Hilton Head Island | Beaufort | 40,500 | 37,099 | 3,401 | 9.17% | 41.36 | 979.21 |
| 11 | Florence | Florence | 38,317 | 37,056 | 1,261 | 3.40% | 20.89 | 1,834.23 |
| 12 | Spartanburg | Spartanburg | 37,876 | 37,013 | 863 | 2.33% | 19.77 | 1,915.83 |
| 13 | Myrtle Beach | Horry | 32,240 | 27,109 | 5,131 | 18.93% | 23.32 | 1,382.50 |
| 14 | Aiken | Aiken | 30,937 | 29,524 | 1,413 | 4.79% | 20.7 | 1,494.54 |
| 15 | Greer | Greenville & Spartanburg | 29,000 | 25,515 | 3,485 | 13.66% | 20.64 | 1,405.04 |
| 16 | Anderson | Anderson | 27,544 | 26,686 | 858 | 3.22% | 14.59 | 1,887.87 |
| 17 | Mauldin | Greenville | 25,188 | 22,889 | 2,299 | 10.04% | 9.95 | 2,531.46 |
| 18 | Hanahan | Berkeley | 23,439 | 17,997 | 5,442 | 30.24% | 10.69 | 2,192.61 |
| 19 | Greenwood | Greenwood | 23,320 | 23,222 | 98 | 0.42% | 16.23 | 1,436.85 |
| 20 | North Augusta | Aiken & Edgefield | 22,932 | 21,348 | 1,584 | 7.42% | 20.03 | 1,144.88 |
| 21 | Conway | Horry | 22,761 | 17,103 | 5,658 | 33.08% | 21.94 | 1,037.42 |
| Taylors CDP | Greenville | 22,475 | 21,617 | 858 | 3.97% | 10.7 | 2,100.47 | |
| St. Andrews CDP | Richland | 21,779 | 20,493 | 1,286 | 6.28% | 6.35 | 3,429.76 | |
| Socastee CDP | Horry | 21,641 | 19,952 | 1,689 | 8.47% | 13.35 | 1,621.05 | |
| 22 | Simpsonville | Greenville | 21,314 | 18,238 | 3,076 | 16.87% | 8.81 | 2,419.30 |
| 23 | Lexington | Lexington | 20,988 | 17,870 | 3,118 | 17.45% | 8.87 | 2,366.18 |
| 24 | Easley | Pickens & Anderson | 20,953 | 19,993 | 960 | 4.80% | 12.26 | 1,709.05 |
| Wade Hampton CDP | Greenville | 20,205 | 20,622 | -417 | -2.02% | 8.96 | 2,255.02 | |
| 25 | Bluffton | Beaufort | 18,897 | 12,530 | 6,367 | 50.81% | 51.3 | 368.36 |
| Five Forks CDP | Greenville | 16,398 | 14,140 | 2,258 | 15.97% | 7.57 | 2,166.18 | |
| 26 | West Columbia | Lexington | 16,282 | 14,988 | 1,294 | 8.63% | 6.99 | 2,329.33 |
| Seven Oaks CDP | Lexington | 16,185 | 15,144 | 1,041 | 6.87% | 7.58 | 2,135.22 | |
| 27 | Clemson | Pickens & Anderson | 16,058 | 13,905 | 2,153 | 15.48% | 7.44 | 2,158.33 |
| 28 | North Myrtle Beach | Horry | 16,032 | 13,752 | 2,280 | 16.58% | 17.09 | 938.09 |
| 29 | Fort Mill | York | 15,029 | 10,811 | 4,218 | 39.02% | 16.34 | 919.77 |
| Ladson CDP | Berkeley & Charleston | 14,770 | 13,790 | 980 | 7.11% | 7.02 | 2,103.99 | |
| Gantt CDP | Greenville | 14,693 | 14,229 | 464 | 3.26% | 9.91 | 1,482.64 | |
| Red Hill CDP | Horry | 14,357 | 13,223 | 1,134 | 8.58% | 11.29 | 1,271.66 | |
| 30 | Cayce | Lexington & Richland | 14,233 | 12,528 | 1,705 | 13.61% | 16.65 | 854.83 |
| Dentsville CDP | Richland | 14,151 | 14,062 | 89 | 0.63% | 6.77 | 2,090.25 | |
| Berea CDP | Greenville | 14,091 | 14,295 | -204 | -1.43% | 7.7 | 1,830.00 | |
| 31 | Beaufort | Beaufort | 13,445 | 12,361 | 1,084 | 8.77% | 27.6 | 487.14 |
| 32 | Orangeburg | Orangeburg | 13,196 | 13,964 | -768 | -5.50% | 8.47 | 1,557.97 |
| 33 | Gaffney | Cherokee | 12,920 | 12,414 | 506 | 4.08% | 8.32 | 1,552.88 |
| 34 | Port Royal | Beaufort | 12,785 | 10,678 | 2,107 | 19.73% | 18.95 | 674.67 |
| Parker CDP | Greenville | 12,571 | 11,431 | 1,140 | 9.97% | 6.82 | 1,843.26 | |
| 35 | Irmo | Richland & Lexington | 12,177 | 11,097 | 1,080 | 9.73% | 6.26 | 1,945.21 |
| 36 | James Island | Charleston | 12,166 | 11,216 | 950 | 8.47% | 12.36 | 984.30 |
| Lake Wylie CDP | York | 10,738 | 8,841 | 1,897 | 21.46% | 7.84 | 1,369.64 | |
| 37 | Forest Acres | Richland | 10,542 | 10,361 | 181 | 1.75% | 4.6 | 2,291.74 |
| 38 | Newberry | Newberry | 10,372 | 10,277 | 95 | 0.92% | 8.57 | 1,210.27 |
| 39 | Moncks Corner | Berkeley | 10,315 | 7,885 | 2,430 | 30.82% | 7.29 | 1,414.95 |
| Oak Grove CDP | Lexington | 10,183 | 10,291 | -108 | -1.05% | 6.65 | 1,531.28 | |
| 40 | Tega Cay | York | 9,946 | 7,620 | 2,326 | 30.52% | 3.87 | 2,570.03 |
| Woodfield CDP | Richland | 9,776 | 9,303 | 473 | 5.08% | 2.74 | 3,567.88 | |
| Little River CDP | Horry | 9,617 | 8,960 | 657 | 7.33% | 10.48 | 917.65 | |
| Garden City CDP | Horry | 9,246 | 9,209 | 37 | 0.40% | 5.37 | 1,721.79 | |
| 41 | Lancaster | Lancaster | 9,134 | 8,526 | 608 | 7.13% | 6.41 | 1,424.96 |
| 42 | Laurens | Laurens | 9,080 | 9,139 | -59 | -0.65% | 10.39 | 873.92 |
| 43 | Georgetown | Georgetown | 9,024 | 9,163 | -139 | -1.52% | 6.91 | 1,305.93 |
| Red Bank CDP | Lexington | 8,920 | 9,617 | -697 | -7.25% | 11.81 | 755.29 | |
| Murrells Inlet CDP | Georgetown | 8,823 | 7,547 | 1,276 | 16.91% | 7.36 | 1,198.78 | |
| Boiling Springs CDP | Spartanburg | 8,743 | 8,219 | 524 | 6.38% | 6.84 | 1,278.22 | |
| 44 | Fountain Inn | Greenville & Laurens | 8,513 | 7,799 | 714 | 9.16% | 7.89 | 1,078.96 |
| 45 | Clinton | Laurens | 8,453 | 8,490 | -37 | -0.44% | 9.88 | 855.57 |
| 46 | Seneca | Oconee | 8,352 | 8,102 | 250 | 3.09% | 7.55 | 1,106.23 |
| Sans Souci CDP | Greenville | 8,288 | 7,869 | 419 | 5.32% | 3.31 | 2,503.93 | |
| 47 | Bennettsville | Marlboro | 8,255 | 9,069 | -814 | -8.98% | 6.12 | 1,348.86 |
| Lugoff CDP | Kershaw | 8,248 | 7,434 | 814 | 10.95% | 15.03 | 548.77 | |
| Powdersville CDP | Anderson | 8,230 | 7,618 | 612 | 8.03% | 13.88 | 592.94 | |
| Sangaree CDP | Berkeley | 8,157 | 8,220 | -63 | -0.77% | 2.03 | 4,018.23 | |
| 48 | York | York | 8,058 | 7,736 | 322 | 4.16% | 8.21 | 981.49 |
| 49 | Union | Union | 8,000 | 8,393 | -393 | -4.68% | 8.08 | 990.10 |
| 50 | Hartsville | Darlington | 7,768 | 7,764 | 4 | 0.05% | 5.72 | 1,358.04 |
| 51 | Camden | Kershaw | 7,126 | 6,838 | 288 | 4.21% | 10.68 | 667.23 |
| Centerville CDP | Anderson | 6,806 | 6,586 | 220 | 3.34% | 5.9 | 1,153.56 | |
| 52 | Lake City | Florence | 6,761 | 6,675 | 86 | 1.29% | 5.22 | 1,295.21 |
| 53 | Marion | Marion | 6,711 | 6,939 | -228 | -3.29% | 4.42 | 1,518.33 |
| 54 | Dillon | Dillon | 6,604 | 6,788 | -184 | -2.71% | 5.22 | 1,265.13 |
| Homeland Park CDP | Anderson | 6,419 | 6,296 | 123 | 1.95% | 4.71 | 1,362.85 | |
| Welcome CDP | Greenville | 6,390 | 6,668 | -278 | -4.17% | 4.64 | 1,377.16 | |
| Laurel Bay CDP | Beaufort | 6,318 | 5,891 | 427 | 7.25% | 4.5 | 1,404.00 | |
| Burton CDP | Beaufort | 6,266 | 6,976 | -710 | -10.18% | 8.54 | 733.72 | |
| 55 | Darlington | Darlington | 6,117 | 6,289 | -172 | -2.73% | 4.55 | 1,344.40 |
| 56 | Clover | York | 5,950 | 5,094 | 856 | 16.80% | 4.46 | 1,334.08 |
| Lake Murray of Richland CDP | Richland | 5,915 | 5,484 | 431 | 7.86% | 5.58 | 1,060.04 | |
| Valley Falls CDP | Spartanburg | 5,885 | 6,299 | -414 | -6.57% | 5.18 | 1,136.10 | |
| 57 | Cheraw | Chesterfield | 5,780 | 5,851 | -71 | -1.21% | 5.42 | 1,066.42 |
| 58 | Hardeeville | Jasper | 5,721 | 2,952 | 2,769 | 93.80% | 45.16 | 126.68 |
| Belvedere CDP | Aiken | 5,706 | 5,792 | -86 | -1.48% | 3.5 | 1,630.29 | |
| Piedmont CDP | Piedmont CDP | 5,648 | 5,103 | 545 | 10.68% | 8.6 | 656.74 | |
| 59 | Chester | Chester | 5,474 | 5,607 | -133 | -2.37% | 3.27 | 1,674.01 |
| 60 | Batesburg-Leesville | Lexington & Saluda | 5,448 | 5,362 | 86 | 1.60% | 7.79 | 699.36 |
| 61 | Walterboro | Colleton | 5,293 | 5,398 | -105 | -1.95% | 6.49 | 815.56 |
| 62 | Central | Pickens | 5,229 | 5,159 | 70 | 1.36% | 2.69 | 1,943.87 |
| 63 | Abbeville | Abbeville | 5,168 | 5,237 | -69 | -1.32% | 6.12 | 844.44 |
| Forestbrook CDP | Horry | 5,111 | 4,612 | 499 | 10.82% | 3.74 | 1,366.58 | |
| 64 | Hollywood | Charleston | 5,084 | 4,714 | 370 | 7.85% | 23.13 | 219.80 |
| 65 | Travelers Rest | Greenville | 5,053 | 4,576 | 477 | 10.42% | 4.52 | 1,117.92 |
| 66 | Edgefield | Edgefield | 4,752 | 4,750 | 2 | 0.04% | 4.18 | 1,136.84 |
| 67 | Barnwell | Barnwell | 4,542 | 4,750 | -208 | -4.38% | 7.85 | 578.60 |
| Southern Shops CDP | Spartanburg | 4,533 | 3,767 | 766 | 20.33% | 3.56 | 1,273.31 | |
| 68 | Mullins | Marion | 4,524 | 4,663 | -139 | -2.98% | 3.06 | 1,478.43 |
| Clearwater CDP | Aiken | 4,497 | 4,370 | 127 | 2.91% | 4.19 | 1,073.27 | |
| Dalzell CDP | Sumter | 4,462 | 3,059 | 1,403 | 45.86% | 5.89 | 757.56 | |
| 69 | Isle of Palms | Charleston | 4,395 | 4,133 | 262 | 6.34% | 4.44 | 989.86 |
| 70 | Surfside Beach | Horry | 4,391 | 3,837 | 554 | 14.44% | 1.93 | 2,275.13 |
| 71 | Belton | Anderson | 4,386 | 4,134 | 252 | 6.10% | 3.84 | 1,142.19 |
| 72 | Walhalla | Oconee | 4,318 | 4,263 | 55 | 1.29% | 3.96 | 1,090.40 |
| Brookdale CDP | Orangeburg | 4,289 | 4,873 | -584 | -11.98% | 3.64 | 1,178.30 | |
| 73 | Woodruff | Spartanburg | 4,191 | 4,090 | 101 | 2.47% | 3.91 | 1,071.87 |
| 74 | Williamston | Anderson | 4,190 | 3,934 | 256 | 6.51% | 3.64 | 1,151.10 |
| Northlake CDP | Anderson | 4,168 | 3,745 | 423 | 11.30% | 4.13 | 1,009.20 | |
| 75 | Ridgeland | Jasper | 4,141 | 4,036 | 105 | 2.60% | 44.45 | 93.16 |
| India Hook CDP | York | 4,118 | 3,328 | 790 | 23.74% | 2.64 | 1,559.85 | |
| Dunean CDP | Greenville | 4,048 | 3,671 | 377 | 10.27% | 1.57 | 2,578.34 | |
| 76 | Manning | Clarendon | 4,042 | 4,108 | -66 | -1.61% | 2.76 | 1,464.49 |
| Newport CDP | York | 3,795 | 4,136 | -341 | -8.24% | 8.71 | 435.71 | |
| 77 | Honea Path | Abbeville & Anderson | 3,747 | 3,597 | 150 | 4.17% | 3.6 | 1,040.83 |
| Saxon CDP | Spartanburg | 3,623 | 3,424 | 199 | 5.81% | 2.39 | 1,515.90 | |
| 78 | Saluda | Saluda | 3,617 | 3,565 | 52 | 1.46% | 3.25 | 1,112.92 |
| 79 | Lyman | Spartanburg | 3,476 | 3,243 | 233 | 7.18% | 5.98 | 581.27 |
| 80 | Duncan | Spartanburg | 3,369 | 3,181 | 188 | 5.91% | 4.67 | 721.41 |
| 81 | Bamberg | Bamberg | 3,342 | 3,607 | -265 | -7.35% | 3.58 | 933.52 |
| 82 | Winnsboro | Fairfield | 3,311 | 3,550 | -239 | -6.73% | 3.23 | 1,025.08 |
| North Hartsville CDP | Darlington | 3,282 | 3,251 | 31 | 0.95% | 4.56 | 719.74 | |
| East Gaffney CDP | Cherokee | 3,274 | 3,085 | 189 | 6.13% | 3.06 | 1,069.93 | |
| 83 | Liberty | Pickens | 3,252 | 3,269 | -17 | -0.52% | 4.45 | 730.79 |
| 84 | Bishopville | Lee | 3,238 | 3,471 | -233 | -6.71% | 2.34 | 1,383.76 |
| 85 | Kingstree | Williamsburg | 3,221 | 3,328 | -107 | -3.22% | 3.15 | 1,022.54 |
| 86 | Pickens | Pickens | 3,190 | 3,126 | 64 | 2.05% | 2.83 | 1,127.21 |
| 87 | Pendleton | Anderson | 3,184 | 2,964 | 220 | 7.42% | 3.79 | 840.11 |
| Arcadia CDP | Spartanburg | 3,159 | 2,634 | 525 | 19.93% | 1.96 | 1,611.73 | |
| 88 | Blythewood | Richland & Fairfield | 3,099 | 2,034 | 1,065 | 52.36% | 9.7 | 319.48 |
| 89 | Allendale | Allendale | 3,046 | 3,482 | -436 | -12.52% | 3.31 | 920.24 |
| 90 | Denmark | Bamberg | 3,019 | 3,538 | -519 | -14.67% | 3.84 | 786.20 |
| 91 | Williston | Barnwell | 2,998 | 3,139 | -141 | -4.49% | 8.95 | 334.97 |
| Hopkins CDP | Richland | 2,985 | 2,882 | 103 | 3.57% | 16.51 | 180.80 | |
| Gloverville CDP | Aiken | 2,925 | 2,831 | 94 | 3.32% | 3.63 | 805.79 | |
| 92 | Andrews | Georgetown & Williamsburg | 2,896 | 2,861 | 35 | 1.22% | 2.2 | 1,316.36 |
| Privateer CDP | Sumter | 2,805 | 2,349 | 456 | 19.41% | 8.2 | 342.07 | |
| 93 | Burnettown | Aiken | 2,800 | 2,673 | 127 | 4.75% | 5.48 | 510.95 |
| 94 | Springdale | Lexington | 2,791 | 2,636 | 155 | 5.88% | 2.73 | 1,022.34 |
| 95 | Folly Beach | Charleston | 2,782 | 2,617 | 165 | 6.30% | 12.51 | 222.38 |
| Elgin CDP | Lancaster | 2,781 | 2,607 | 174 | 6.67% | 4.86 | 572.22 | |
| Wilkinson Heights CDP | Orangeburg | 2,723 | 2,493 | 230 | 9.23% | 3 | 907.67 | |
| 96 | Pageland | Chesterfield | 2,704 | 2,760 | -56 | -2.03% | 4.37 | 618.76 |
| Roebuck CDP | Spartanburg | 2,670 | 2,200 | 470 | 21.36% | 4.3 | 620.93 | |
| Lakewood CDP | Sumter | 2,670 | 3,032 | -362 | -11.94% | 7.56 | 353.17 | |
| 97 | Loris | Horry | 2,651 | 2,396 | 255 | 10.64% | 3.1 | 855.16 |
| 98 | Hampton | Hampton | 2,639 | 2,808 | -169 | -6.02% | 4.51 | 585.14 |
| 99 | Ravenel | Charleston | 2,628 | 2,465 | 163 | 6.61% | 12.64 | 207.91 |
| 100 | Wellford | Spartanburg | 2,563 | 2,378 | 185 | 7.78% | 2 | 1,281.50 |
| 101 | McCormick | McCormick | 2,532 | 2,783 | -251 | -9.02% | 4.05 | 625.19 |
| 102 | Landrum | Spartanburg | 2,531 | 2,376 | 155 | 6.52% | 2.3 | 1,100.43 |
| Graniteville CDP | Aiken | 2,516 | 2,614 | -98 | -3.75% | 3.31 | 760.12 | |
| 103 | Westminster | Oconee | 2,503 | 2,418 | 85 | 3.52% | 3.41 | 734.02 |
Annual Estimates of the Resident Population: April 1, 2010 to July 1, 2016
Source: U.S. Census Bureau, Population Division
Release Date: May 2017.
As of 2024 the conforming loan limit across the United States for single-family homes is set to $806,500, with a ceiling of 150% that amount in HERA high-cost areas where median home values are higher. With the state of South Carolina having below average median home prices, the $806,500 ceiling apply statewide for single unit homes. Dual unit homes have a limit of $1,032,650, triple unit homes have a limit of $1,248,150 & quadruple unit homes have a limit of $1,551,250. Residents purchasing premium properties in the Charleston metro area may exceed these limits, requiring them to obtain a jumbo mortgage. Jumbo loans typically have a slightly higher rate of interest than conforming mortgages, though spreads vary based on credit market conditions.
The homeownership rate in South Carolina is over sixty percent and the most popular type of loan is a 30 year mortgage. Given that homes are quite affordable across the state, 15 year fixed loans are another popular option which helps home buyers build equity faster and save on interest expenses.
Adjustable rate mortgages (ARM) are also an option for potential homeowners who don't believe they will live in the home for many years and want to write off interest payments. Balloon mortgages are another route for aspiring homeowners. Balloon mortgages are when a large portion of the borrowed principle is repaid in a single payment at the end of the loan period. Balloon loans are not common for most residential buyers, but are more common for commercial loans and people with significant financial assets.
Mortgage underwriters prefer debt-to-income ratios to be below 40%, but other factors are considered on the loan application. When qualifying for a loan, a credit score of 720 or better can help secure a favorable loan. As a general rule of thumb, coming to the table with a 20 percent down payment is usually the best approach. This down payment requirement does not apply for Federal assistance programs such as FHA, in which applicants can have a lower credit score and income but still receive financing.
The piggyback loan is another type of mortgage which is simply two mortgages in one. The piggyback loan can eliminate the need for private mortgage insurance by covering 80% of the home's value with the first loan, while the second loan helps to pay for part of the down payment.
Military and veterans are usually offered special benefits and rates when applying for a VA loan in South Carolina, such as full financing and no closing costs. In addition, most lenders look at only the past 12 months of a veteran's credit when considering the loan.
The Department of Housing and Urban Development (HUD) offers special loan programs such as FHA loans to those who may not qualify for conventional loans. South Carolina does offer housing assistance programs such as the aforementioned FHA loan, but some other options are also available. HUD offers Public Housing and Choice vouchers (PHA), also called section 8, to offer subsidized housing for those who qualify.
USDA loans can help people with low incomes in rural parts of the state qualify for a subsidized low-interest loan.
On South Carolina's state government website, there is a variety of assistance programs available. Aside from Federal programs, state programs such as the South Carolina Homeownership and Employment lending program exist. These programs help secure housing loans for those who don't apply. There are also programs that offer rental assistance for those who qualify.
South Carolina has a very low to moderate earthquake risk, with the risk being relatively higher near the coast. Here are the counties with a risk above very low.
Standard rental and homeowner insurance policies typically do not cover earthquake damage, though they usually cover losses caused by fires which resulted from an earthquake. You can supplement your homeowner's insurance with an earthquake policy.
While not as exposed to hurricanes as Florida, South Carolina weather can include hurricane winds and flooding. Therefore, many lenders require weather-related insurance. In 2015 a storm dropped over 2 feet of rain, causing deadly flooding & over $1 billion in damages across the state, while less than 200,000 homeowners across the state were carrying flood insurance. Berkely county is considered to be of moderate hurricane storm surge risk. Here is a list of counties across the state which are considered above a very low risk of flooding.
Typically, homes built after 2002, when building code regulations tightened, are subject to lower insurance rates than older homes. On the other hand, homes without hurricane straps, with roofs that do not meet current standards for wind, with older plumbing or with outdated electrical systems may be difficult – or very expensive – to insure.
Home buyers with mortgages in high-risk areas are required to buy flood insurance. Most flood insurance policies are sold by the United States federal government through The National Flood Insurance Program. Under-priced flood insurance in high-risk areas act as a subsidy to wealthy homeowners.
The NFIP does not charge nearly enough to cover the expected costs of its liabilities. The assessments are not sufficient to build any buffer to cover an extraordinary year, such as what occurred with Hurricane Katrina in 2005 or Hurricane Sandy in 2012. Because homeowners don’t incur the full cost of building in a flood zone we end up with more houses there than if homeowners incurred the full cost of the flood risk, which exacerbates the government's costs in the next disaster.
Homeowners who live in lower risk areas & are not required to purchase flood insurance heavily cross-subsidize homeowners who are in areas where floods are more common. You can learn more about insurance across the state here.
The risk of wildfires is considered moderate to very high across much of the state. Fire damages from wildfires & other types of fires are typically covered in most homeowner's insurance policies. If you own expensive items you may want to keep an up-to-date household inventory list which lists specific valuables, such as fine art & jewelry.
Much of the state is considered to have a moderate tornado risk. A basic homeowners policy should cover financial damages from tornadoes.
Hail damage is not uncommon across the state. Damage from hail is typically covered by home insurance policies.
Rates vary by county with Newberry County, Richland County & Lee County having the highest rates across the state at 0.82%, 0.77% & 0.74% respectively. Even in the highest rate counties overall property tax payments are held down by low property prices. In 2016, South Carolina had the seventh lowest property tax assessment rate at 0.63%. Low property taxes are offset by more aggressive sales (6%) & personal income (7%) taxes along with taxes on lodging (7%) & motor vehicle (5%) sales. The average property tax assessment in the state was $1,294. In Charleston that bill expands to $2,062.
In South Carolina, real estate law is generally handled within the court system, as opposed to states like California who may settle disputes privately. South Carolina is judicial foreclosure state. This means that the lender must prove they are entitled to the foreclosure in a court of law.
The homeowner has the right to contest the foreclosure by conducting discovery, raising defenses, and filing for counterclaims. The homeowner has several options of recourse such as making the lender prove a default occurred, and dispute the amount owed.
South Carolina allows for mortgage deficiency, meaning the borrower owes any money lost to the lender at a foreclosure. Deficiency is the difference between the amount obtained at the foreclosure and the amount owed to the lender.
For instance, if the homeowner owes $300,000 but the lender sells the property at a foreclosure sale for only $280,000, homeowner would owe $20,000. In other words, South Carolina is what is known as a recourse state, meaning the lender has can seek to cover their losses.
South Carolina enacted what is called the South Carolina Residential Property Condition Disclosure Statement. Enacted in 2003, it requires that a seller disclose any problems associated with the home they are selling or leasing. It consists of a series of checkboxes that list any potential problems: the homeowner is expected to list any problems known, and if any are found before the sale is completed they are to alert the buyer.
In summary, South Carolina is a desirable location for potential residents. With a growing economy, low mortgage costs, and reasonably priced housing, it is a great destination for people looking to live in a place with plenty to do as well. Here are some helpful resources to learn more about local real estate & living in the state.
The Federal Reserve has begun lowering interest rates. Lock in today's low rates and save on your loan.
Are you paying too much for your mortgage?
Check your mortgage options with a trusted El Monte lender.
Answer a few questions below and connect with a lender who can help save you money today!